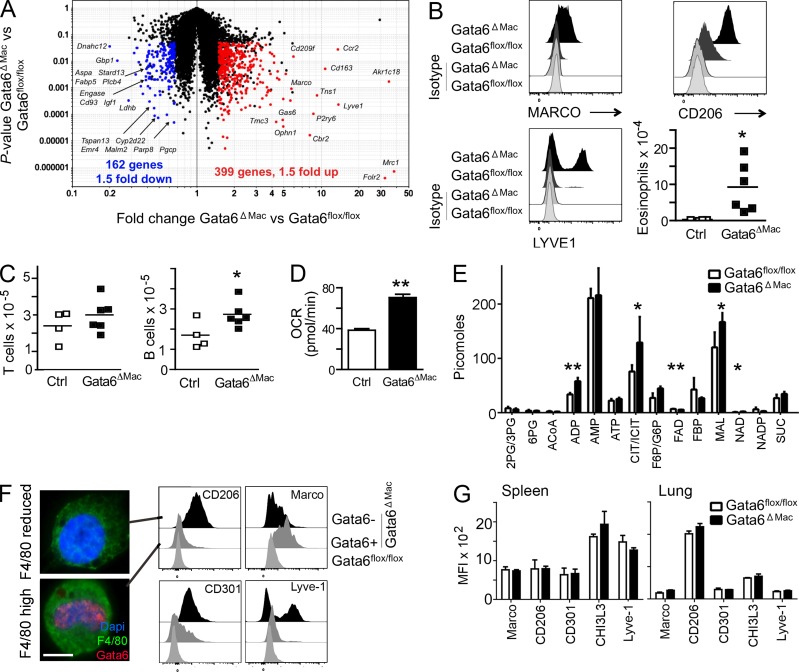
Figure 2.
Gene expression changes and alternative activation of Gata6ΔMac macrophages. (A) Scatter plots depict mRNA transcripts significantly decreased (left, blue) or increased (right, red) in Gata6flox/flox (Ctrl) versus Gata6ΔMac mice. (B) Expression of macrophage polarization and activation markers and eosinophil counts in the peritoneum. (C) Peritoneal B1-a and T lymphocyte counts. (D) Oxygen consumption rates (OCR) of Gata6flox/flox and Gata6ΔMac mice. (E) Mass spectrometric analysis of metabolites. (F) As shown in Fig. 1 D (blue line in flow cytometry gate), Gata6ΔMac peritoneal macrophages were sorted into two populations based on a retention or reduction of the originally high levels of F4/80, then stained for nuclear Gata6. Bar, 5 µm. Various markers on Gata6flox/flox (light gray histograms) and Gata6ΔMac macrophages with preserved expression of Gata6 (Gata6+, from F4/80high gate; gray histograms) and Gata6ΔMac with efficient deletion of Gata6 (Gata6− from F4/80reduced gate; black histograms) were compared. (G) Analysis of similar markers on spleen or lung macrophages. Data in the figure summarize results from three or more independent experiments with two to five replicates per experimental group. Metabolic analysis was performed using five separate pools of sorted macrophages for each genotype. *, P < 0.05; **, P < 0.001 relative to controls, assessed using two-tailed Student’s t tests.

