Figure 6.
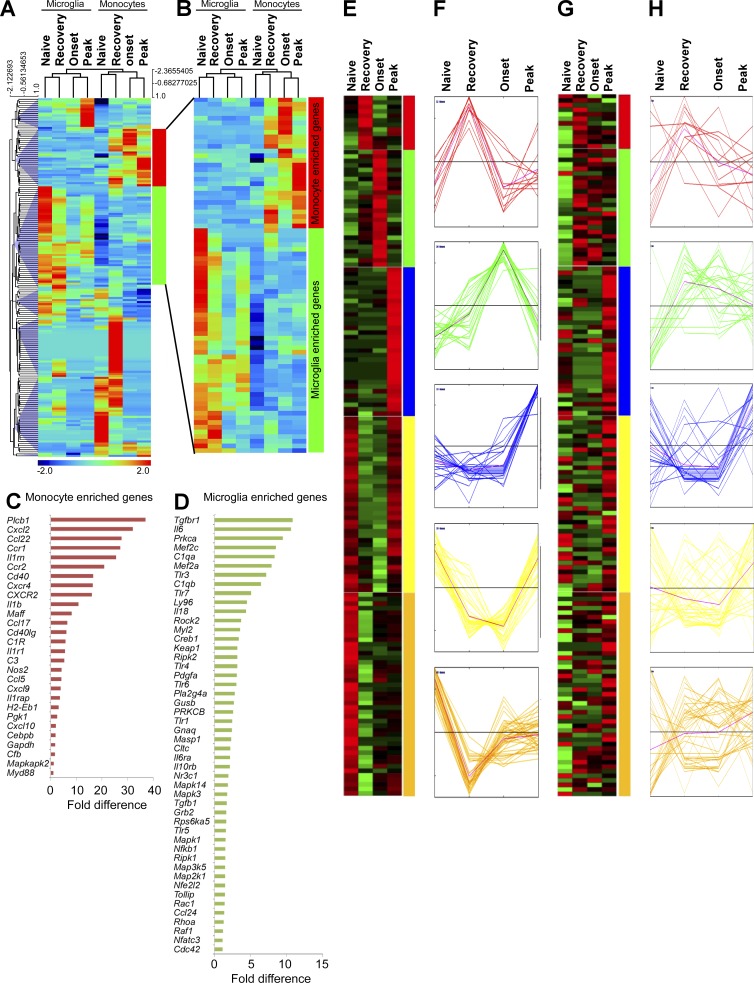
Inflammatory signature in MiDMs versus MDMs in the CNS of Cx3cr1gfp/+::Ccr2rfp/+ mice with EAE. (A) Quantitative nCounter expression profiling of 179 inflammation related genes was performed in CNS-derived GFP+ microglia and RFP+ recruited monocytes from naive and EAE mice at onset, peak and recovery stages. Each row of the heat map represents an individual gene and each column an individual group from pool of 5 mice at each time point. The relative abundance of transcripts is indicated by a color (red, higher; green, median; blue, low). For A–H, we studied five mice in each time point (onset, peak, recovery) from 3 EAE inductions; 8–10 mice were immunized in each induction. (B) Heat map of differentially expressed microglia and monocyte genes. (C) Enriched monocyte genes as compared with resident microglia. Bars represent fold changes of gene expression across naive and all disease stages versus resident microglia. (D) Enriched microglia genes as compared with recruited monocytes. Bars represent fold changes of gene expression across naive and all disease stages versus recruited monocytes. (E–H) K-means clustering of inflammation genes in resident microglia and recruited monocytes. K-means clustering was used to generate 5 disease stage–related clusters in MiDMs. Heat map (E) and expression profile (F) of inflammation genes in MiDMs are shown by generated clusters. MDM expression matrix overlaid on microglial based clusters shows (G) heat map and (H) expression profile.

