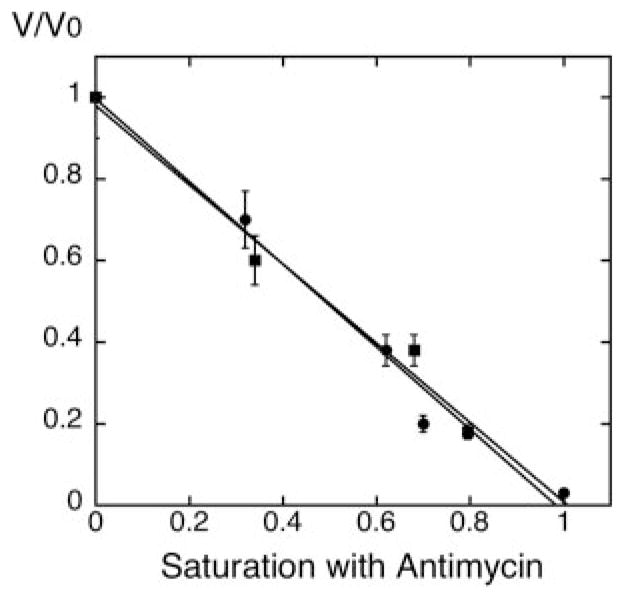
Fig. 2. Titration of the Q2H2:cytochrome c oxidoreductase (complex III) activity with antimycin A in mitochondria from wild type and crd1Δ cells.

Mitochondria were isolated from both wild type (DL1, CRD1, ●) and cardiolipin-lacking cells (YZD5, crd1Δ, ■) grown at 30 °C in YPEG to exponential phase. Q2H2:cytrochrome c oxidoreductase activity of isolated mitochondria was determined with different concentrations of antimycin A, as described under “Experimental Procedures.” V/Vo represents the complex III activity at each antimycin A concentration relative to the activity with no antimycin A. The x-axis represents the fractional saturation by antimycin A with complete inhibition set to 1.
