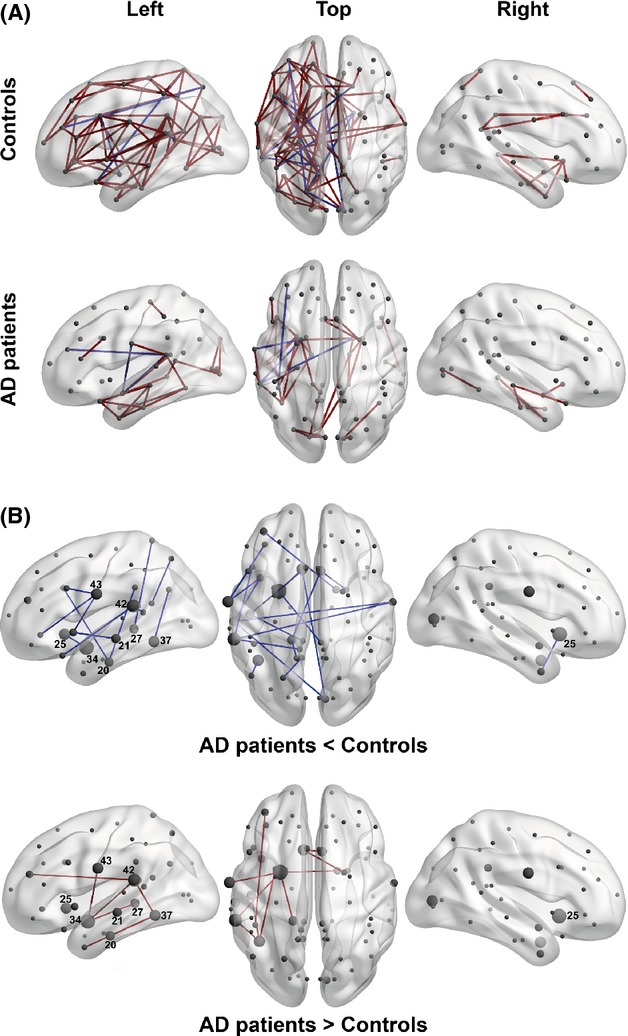
Figure 3.

The MTR-based covariance networks in controls and AD patients. (A) The networks are rendered on the 3D smoothed brain of the ICBM152 template with the BrainNet Viewer (http://www.nitrc.org/projects/bnv/). They are presented in the left lateral, top, and the right lateral views of the brain for controls (top row) and AD patients (bottom row). Nodes are designated as gray circles located at the centers of mass of each ROI. Significant edges (lfdr < 0.2) are drawn in red for positive partial correlations and in blue for negative partial correlations. (B) The edges significantly different between elderly controls and AD patients (lfdr < 0.2) are rendered as in Fig. 3A. A node size corresponds to the degree of difference (i.e., to the number of edges significantly different in the AD compared to the control group). The nodes labeled with the associated Brodmann area number in white have degrees larger than two. The blue edges are present in controls, but not in AD patients (top row), while the red edges are present in AD patients, but not in controls (bottom row).
