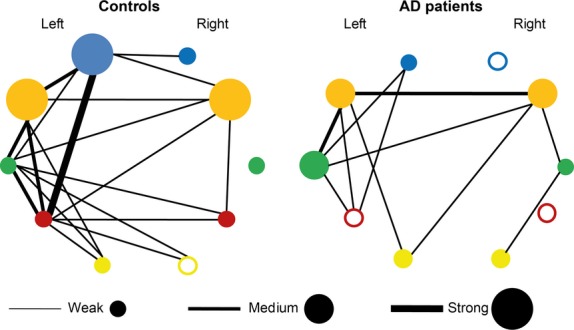
Figure 5.

Macro-networks in elderly subjects and AD patients. The networks including the frontal (blue), paralimbic (orange), temporal (green), parietal (purple), and occipital (yellow) regions are drawn for controls and AD patients. Nodes represent intraregional connectivity (correlation). The empty nodes stand for insignificant intraregional correlation, while colored nodes correspond to significant intraregional correlations. In so doing, the radius of a colored node corresponds to an intracorrelation level (weak, medium, or strong). Edges represent interregional connectivity (correlations) and their thickness matches one of the three levels described for the nodes.
