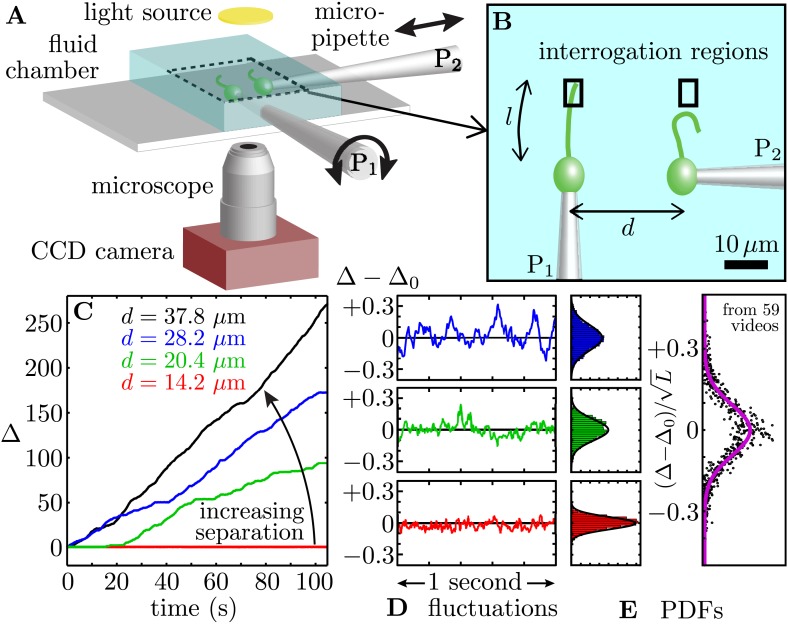
Figure 1. Synchronized pairs of beating flagella.
(A) Experimental apparatus and (B) cell configuration. (C) Extracted phase difference at four different interflagellar spacings, as indicated. These separations correspond to scaled spacing L = d/l of 0.85, 1.22, 1.69, and 2.27. (D) fluctuations during phase-locked periods around the average phase lag, Δ0, and (E) the fluctuations’ probability distribution functions (PDFs), each cast in terms of the rescaled separation-specific variable (Δ − Δ0)/√L. Solid lines represent Gaussian fits. Further details of the phase extraction procedure can be found in Figure 1—figure supplement 1. Samples of the four processed videos corresponding to the cells in Figure 1C are shown in Video 1.


