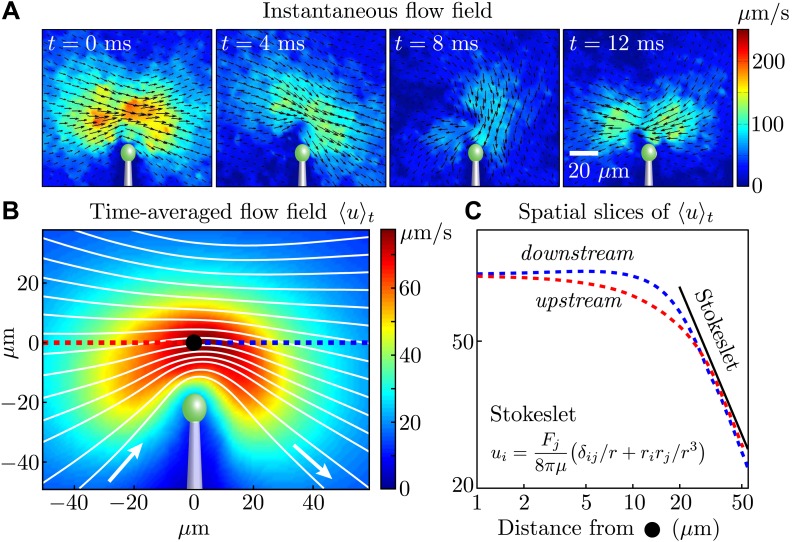
Figure 2. Measured flagellar flow field.
(A) Time-dependent flow field for an individual cell measured using particle image velocimetry. Results are shown for the first half of the beating cycle. (B) Time-averaged flow field (averaged across 4 cells with τ ∼ 1000 beats for each). The velocity magnitude (colour) and streamlines (white) are shown. (C) Velocity magnitude upstream (red) and downstream (blue) of the origin (black dot in B).

