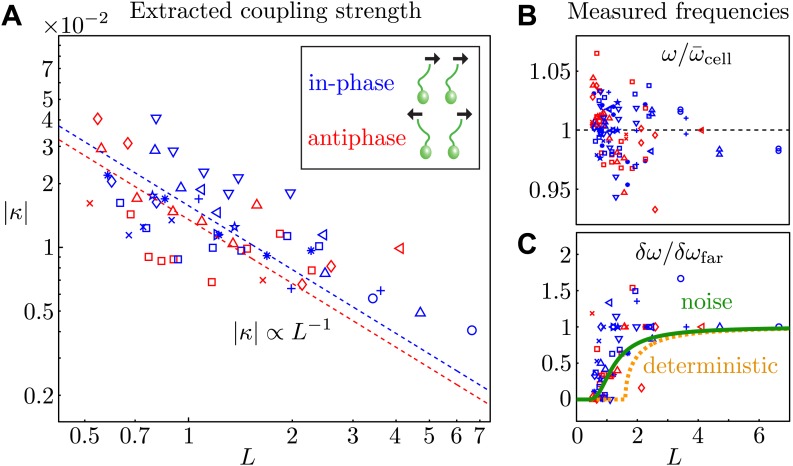
Figure 5. Coupling strength.
(A) Dimensionless interflagellar coupling strength as a function of the scaled spacing L = d/l (log–log scale). The dotted lines represent fits of the form with k = 0.016 (in-phase) and k = 0.014 (antiphase). (B) Measured beat frequency of each flagellum, nondimensionalised by the average value for that cell across several videos. (C) Measured frequency difference as a function of spacing L. The curves represent the predictions based on the average extracted model parameters in the absence (orange) and presence of noise (green). Symbols represent different pairs of cells, with the in-phase (blue) and antiphase (red) configurations shown.

