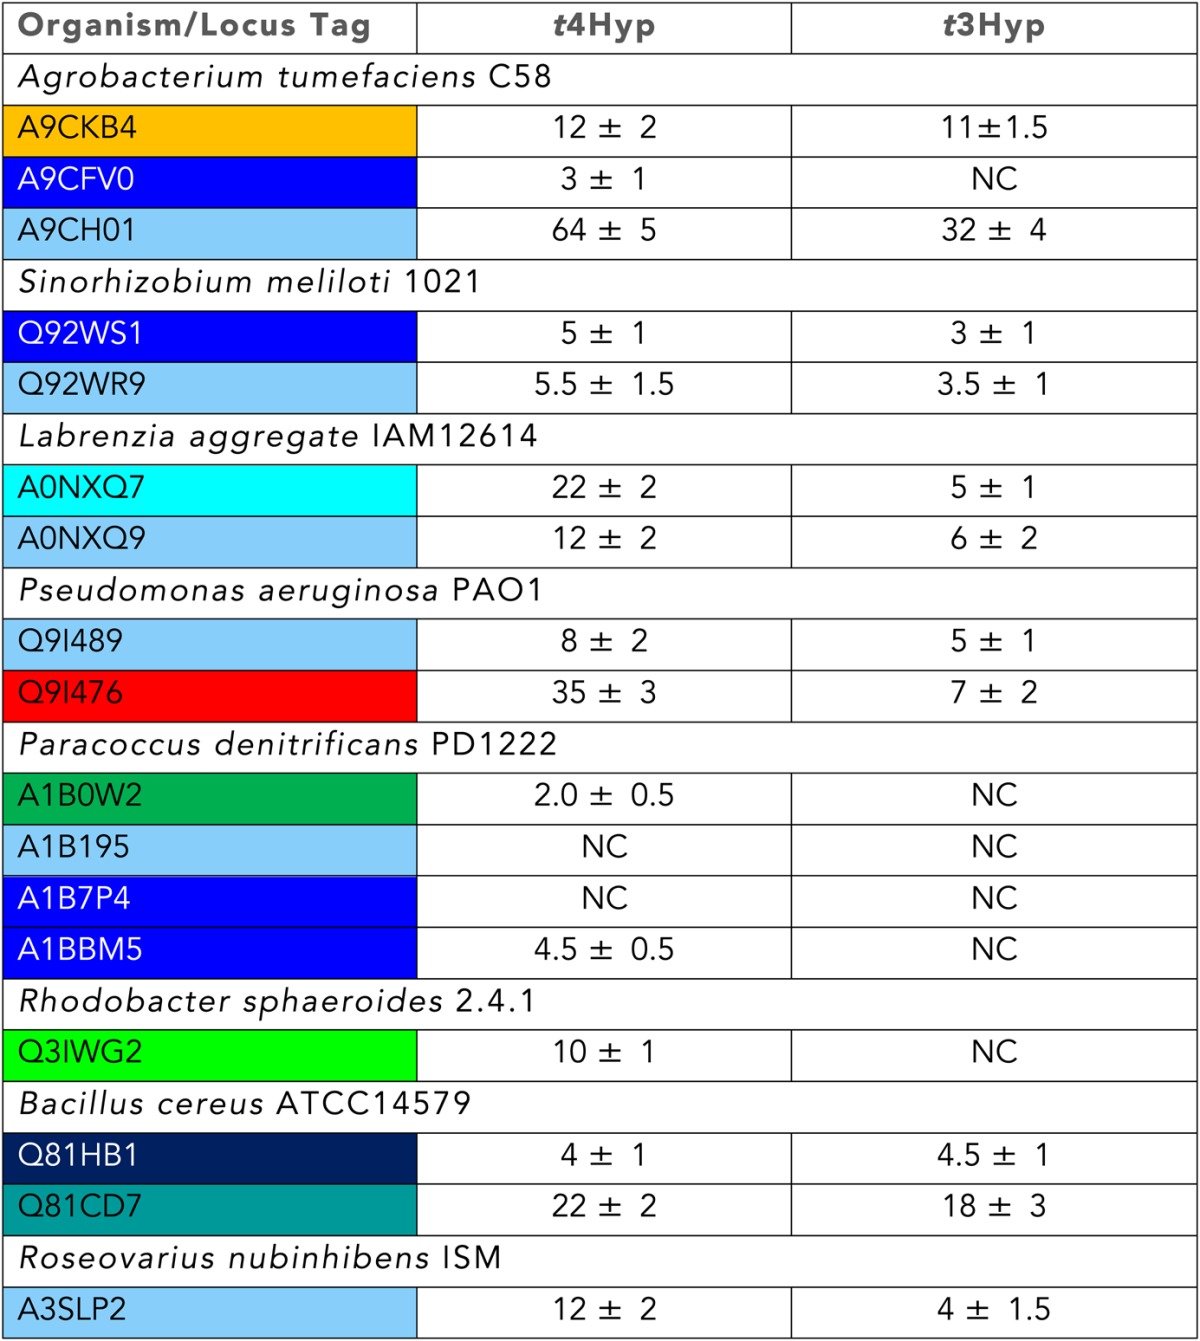
Table 4.
Transcriptional analysis of PRS members

Fold change in expression for each gene when grown on the indicated carbon source, relative to growth on D-glucose. The identities of the bacterial species and the protein encoded by each gene are indicated. Fold-changes are the averages of five biological replicates with standard deviation (p value <0.005). NC, no change.
