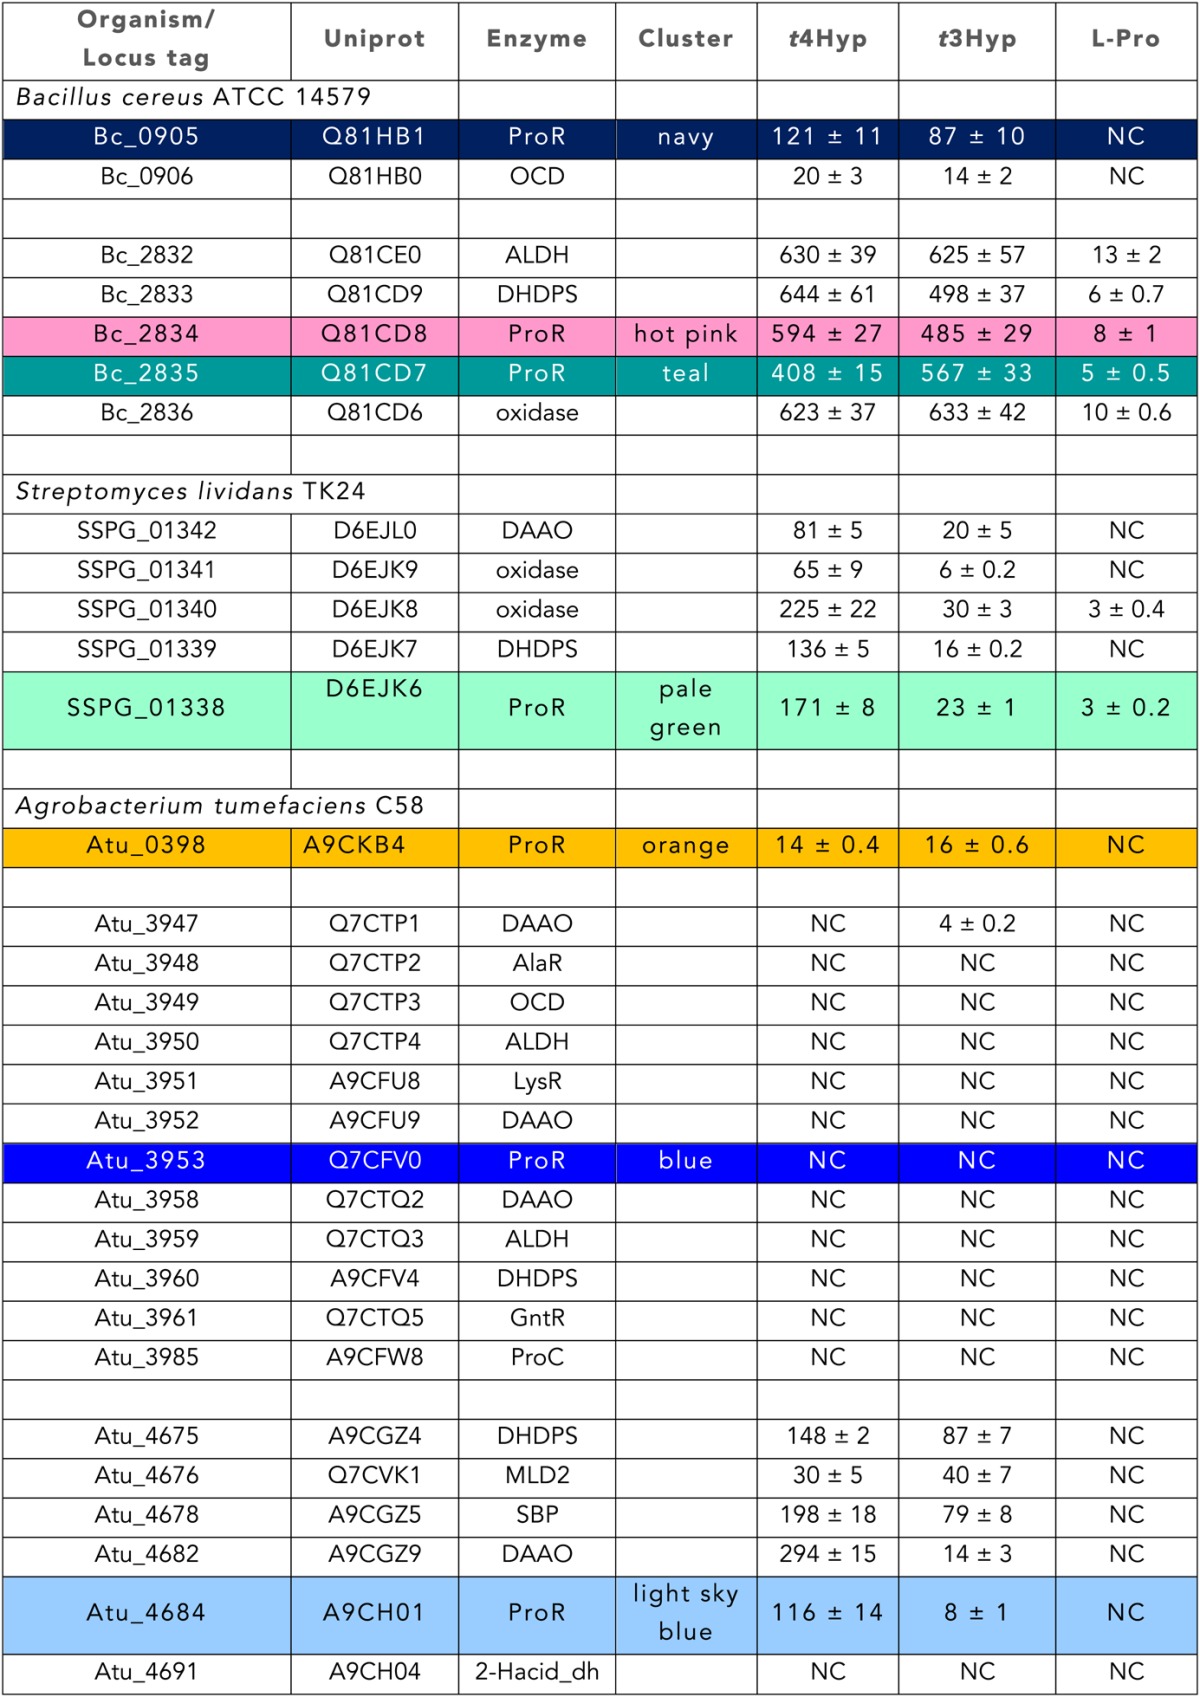
Table 5.
Transcriptional analysis of genome neighborhoods

Fold changes in expression for the indicated gene when grown on the indicated carbon source, relative to growth on Dglucose. Fold changes are the averages of three biological replicates with standard deviation. NC, no change.
