Figure 3.
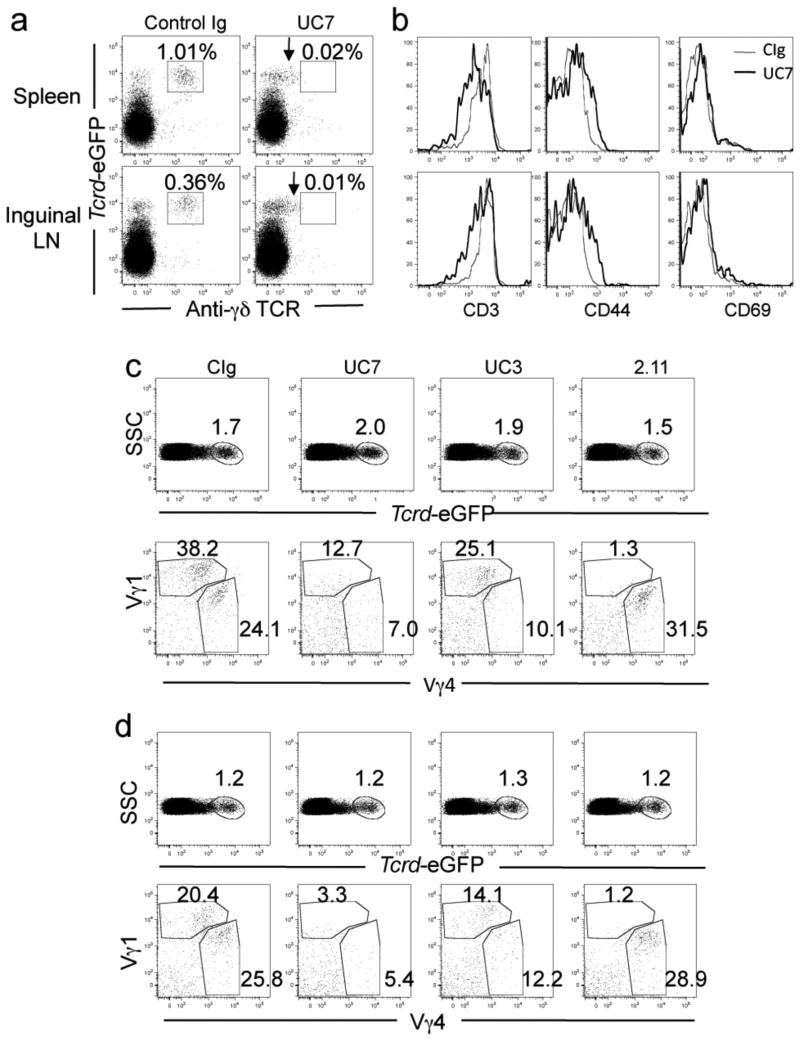
In vivo antibody targeting activates γδ T cells and downregulates surface TCR expression. C-EAE was induced in Tcrd-eGFP primed subcutaneously with 200 μg MOG33-55/CFA and pertussis toxin as described in Materials and Methods and mice were treated i.v. with 200 μg of the indicated antibodies on days 0 and 2. Cells were isolated from the spleen and inguinal lymph nodes on day 7, γδ TCR-GFP and cell surface molecules were visualized by flow cytometry. (a) GFP and TCR surface staining of T cells from the spleen and draining lymph nodes. Arrow indicates downregulated surface expression. (b) Activation marker expression on GFP+ cells. (c-d top panel) Percent of GFP+ cells in the spleen (c) and inguinal lymph nodes (d). (c-d bottom panel) Surface expression of Vγ1 and Vγ4 TCR from GFP+ cells in the spleen (c) and lymph nodes (d). Data are representative of at least 2 independent experiments and represents the average of 4 mice per group.

