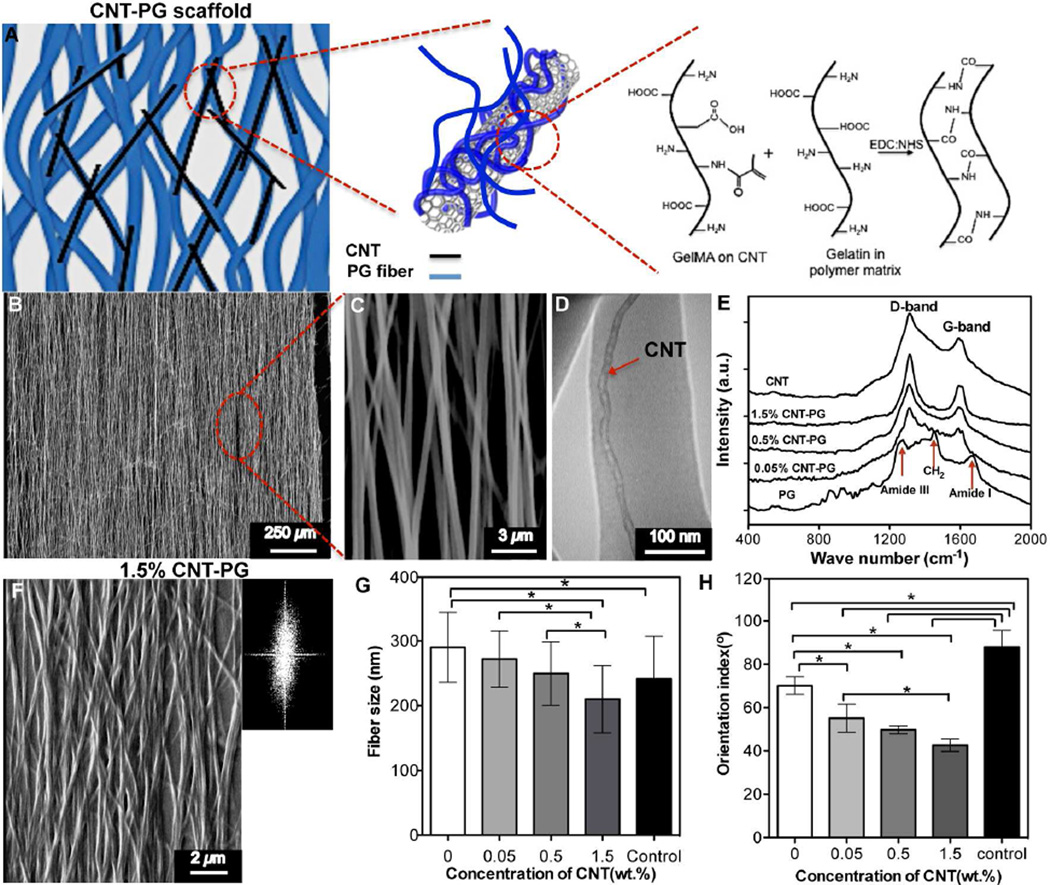
Figure 1.
Structural characteristics of CNT-PG scaffolds. A) Schematic drawing showing the interactions of CNTs with PG scaffold upon crosslinking with EDC/NHS. B and C) SEM images showing uncrosslinked 1.5% CNT-PG scaffold. D) A representative TEM image of 1.5% CNT-PG confirming the well dispersion of CNTs (arrow) aligned along the nanofibers axis. E) Raman spectra of the CNTs and CNT-PG scaffolds. F) SEM and FFT (Inset) images of crosslinked 1.5% CNT-PG. G and H) The average fiber size and orientation index of nanofibrous scaffolds, demonstrating that increasing CNTs content resulted in reduced fiber size and enhanced fiber orientation (random 1.5% CNT-PG scaffold was considered as control) (*: P<0.05).

