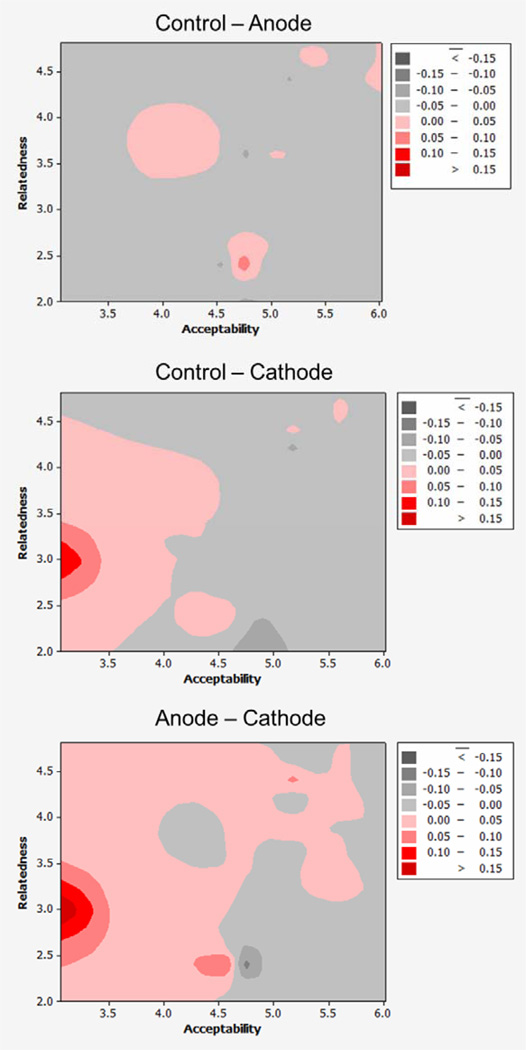
Figure 6.
Top: The difference in hit rates between control and the anode conditions as a function of mean target acceptability and inter-item relatedness. Middle: The difference between control and cathode-simulated group. Bottom. The difference between anode and cathode groups. The red color in the middle and bottom panels indicates acceptability/relatedness combinations for which the cathode group performs more poorly than the control group and than the anode group. The dark red area on the lower-left shows considerably poorer performance of the cathode group on the category of THINGS WITH HANDLES.

