Abstract
Slow proliferation is one of characteristics of stem cells. We examined the presence, distribution and regulation of slow-cycling cells in the developing and growing skeleton using a pulse-chase method with a new nucleoside derivative, 5-ethynyl-2’-deoxyuridine (EdU). C57BL/6 mice received daily intraperitoneal injections of EdU from postnatal day 4 to day 7. One day after the last EdU injection, a large population of cells in articular cartilage and growth plate was labeled. Six weeks after the last injection, the number of EdU-labeled cells dramatically decreased, but a small number of them were dominantly present in the articular surface, and the labeling index was significantly higher in the surface than that in the rest of articular cartilage. In the growth plate, most EdU-positive cells were found in the top layer that lies immediately below the secondary ossification center. Interestingly, postnatal conditional ablation of β-catenin in cartilage caused a complete loss of the EdU-labeled cells in growth plate that displayed disorganization and dysfunction. Together, our data demonstrate that slow-cycling cells do reside in specific locations and numbers in both articular cartilage and growth plate. The β-catenin signaling pathway appears to play a previously unsuspected role in maintenance of the slow-cycling cells.
Introduction
Epiphyseal cartilage is located at the end of long bones and is divided into growth plate and articular chondrocytes. These play distinct roles in long bones: the former is essential for longitudinal bone growth whereas the later provides smooth movement of synovial joints of the long bones through life. We and others have previously demonstrated that articular chondrocytes originate from specific progenitor cells, collectively called interzone cells that give rise to synovial joint tissues, while growth plate cells derive from a different source 1,2. However, it remains unclear whether the long term function, maintenance and renewal of growth plate and articular chondrocytes involves, and is sustained by local progenitor/stem cells. Previous pulse-chase studies using nucleoside derivatives found that the epiphyseal region of developing long bones does display cells at specific anatomical sites that exhibit a slow cell cycle, a phenotypic trait of stem/progenitor cells 3-6. The cells were detectable in: the top and narrow resting zone of growth plate; the wedge-shaped groove of Ranvier near the upper portion of the growth plate; and the ring of Lacroix, a fibrous structure that encircles the growth plate 3-6. The cells were proposed to represent a renewal cell source to supply and re-supply the growth plate and thus, sustain continuous long bone growth in both length and width. While the evidence in these studies is important and broadly relevant, there have been contradictory data stemming from other studies and studies carried out in different species. Hence, there is no definitive and conclusive understanding regarding the presence, distribution and regulation of stem/progenitor cells in growth plate and articular cartilage.
To reassess these important issues and obtain clearer information and insights, we examined the localization of the slow-cycling cells in synovial joints and growth plates in postnatal mice using 5-ethynyl-2’-deoxyuridine (EdU), a thymidine analogue instead of tritium thymidine and 5-bromo-2-deoxyuridine DNA analogues that have been used for determination of the slow-cycling cells7,8. In this method, the synthetic analogues are administrated in animals for a long period to allow even stem cells to complete at least one cellular cycle. A prolonged chase period results in dilution of the incorporated DNA analogues in the cells that actively proliferate, but the slow-cycling cells remain labeled. Because the incorporated EdU is visualized by fluorescent chemical modification, non-specific staining is reduced and the detection sensitivity and specificity are enhanced9. The Wnt/β-catenin signaling regulates stem/progenitor cell function in various organs and tissues10-13 and is also an important regulator of several aspects for joint and growth plate dev development and function.1,14-17 Therefore, we asked whether it might regulate also the occurrence and behavior of slow cycle cells in joints and growth plates. Our data show that slow-cycle cells are in fact present in the epiphyseal region of postnatal mouse long bones where they occupy highly restricted localizations and require β-catenin signaling for their presence and possibly, long term functions.
Methods
Mice
Studies were conducted after approval by the Institutional Animal Care and Use Committee of the Children’s Hospital of Philadelphia. C57BL/6J mice (Jackson Laboratory, Bar Harbor, ME) received daily intraperitoneal injections of EdU (Life Technology, 5-ethynyl-2’-deoxyuridine, 5 μg/10 μl/mouse) four times from P4. After one day, 6 or 12 weeks from the last injection, the knee joints were harvested and processed to prepare longitudinal sections. For the EdU labeling at the embryonic stage, the pregnant mice received daily intraperitoneal injections of EdU (250 μg/100 μl) 4 times from 12 days to 15 days post-conception. The pups were then sacrificed at postnatal days 1, 10, 15, and 30, and their knee joints were harvested.
Col2CreER;β-cateninfl/fl mice conditionally deficient in β-catenin were created by mating β-catenin-floxed mice (β-cateninfl/fl) possessing loxP sites in introns 1 and 6 in the β-catenin gene (6.129-Ctnnb1tmKem/KnwJ line purchased from the Jackson Laboratory, Bar Habor, ME, USA) with Col2a1-CreERT mice (kindly provided by Dr S. Mackem, National Cancer Institute) that harbor Cre recombinase linked to a modified estrogen receptor (ER) ligand-binding domain under the control of a collagen 2a1 promoter/enhancer18. To ablate the β-catenin gene, we injected tamoxifen at a dose of 100 μg/10 μl per mouse per day on postnatal day 4 and 6. Mice (three β-cateninfl/fl;Col2a1-CreER mice and three β-cateninfl/fl mice) were then sacrificed at 4 and 12 weeks of age. Limb skeletons were analyzed by taking soft x-ray images using Bioptics piXarray100 (Core Medical Imaging, Inc., Kenmore, WA) set to the automatic exposure mode. Knee joints were dissected, fixed with 4% (v/v) paraformaldehyde, decalcified with EDTA for 7-10 days and embedded in paraffin. Sagittal longitudinal sections of tibias and femurs (5 μm) were prepared.
Detection of EdU-labeled slow-cycling cells
The paraffin sections were digested with 0.1% pepsin in 0.01N HCl at 37°C for 15 minutes and subjected to EdU staining using the EdU Click-iT EdU Imaging Kit (Life Technology, Grand Island, NY) according to the manufacturer’s protocol, and then stained with DAPI (0.5 μg/ml, Life Technology) for 5 min. The images of EdU and DAPI fluorescence in the growth plate and the articular cartilage in the medial tibial plateau were captured using the confocal microscope system (Leica TCS LSI, Leica Microsystems Inc. Buffalo Grove, IL) or the Eclipse TE2000 microscope (Nikon Instruments, Inc. Melville, NY). Numbers of EdU- and DAPI-positive cells were quantified by IMAGEJ software, and EdU labeling index that was a ratio of the EdU-positive cell number to the DAPI-positive cell number was calculated. The EdU-labled cells in the synovium and muscle were used as an internal control, and the threshold of fluorescence intensity was set by the range that can detect these cells. We analyzed two to three fields/slide, three slides/mouse and three mice/group.
Histological and immunohistochemical analyses
The sections were also subjected to histological examination with hematoxylin/eosin. For collagen 10 immunostaining, the sections were incubated with 0.1% pepsin in 0.01N HCl at 37°C for 15 minutes and 3% hydrogen peroxidase treatment for 10 minutes, and then stained with the rabbit polyclonal anti-collagen 10 antibody (1:2000, Cosmo BIO Co., LTD, Tokyo, Japan). The bound antibodies were visualized using the rabbit-specific HRP/DAB detection IHC kit (Abcam, Cambridge, MA) followed by methyl green counterstaining.
Statistical methods
Results were analyzed using the InStat 3 version 3.1a (GraphPad Software, Inc., La Jolla, CA). A one-way Analysis of Variance (ANOVA) with a Tukey-Kramer Multiple Comparison Test was used to identify the differences. The threshold for significance for all tests was set to p<0.05.
Results
EdU labeled cells in the epiphysis and synovial joints
To evaluate the presence and distribution of slow-cycling cells in the epiphyseal region of growing long bones, we injected postnatal day 4 (P4) C57BL/6j mice daily with the nucleoside derivative 5-ethynyl-2’-deoxyuridine (EdU) a total of 4 times until P7. One day after the last injection, some mice were sacrificed to harvest their knee joints. Analysis of EdU localization revealed that a large number of cells in articular cartilage (Figs. 1A, 1C and 1E), growth plate from the resting zone to the hypertrophic zone (Figs. 1B, 1D and 1F) and surrounding connective tissues had incorporated EdU, indicating that the EdUs were successfully incorporated into the cells that had replicated during P4 to P7. Six weeks after the EdU injections, the number of EdU-labeled cells dramatically decreased. However, the labeled cells were still clearly detectable in synovium (Fig. 2, yellow arrows), infrapatella fat pad (Fig. 2, orange arrows), perichondrium (S-Fig. 1B) and ligament attachment sites (S-Fig. 1C), indicating that slow-cycling cells reside in those area and sites. The groove of Ranvier has been reported to contain progenitors of chondrocytes and osteoblasts3,6 and we found that it contained EdU-labeled cells (S-Fig. 1D, arrows in square). We observed some variability in EdU-labeled cell number in the groove, possibly due to sectioning depth and orientation relative to the overall groove morphology, but the cells were consistently observed in all the other tissues and sites above.
FIGURE 1. Multiple EdU injections labeled most cells in articular cartilage and growth plate.
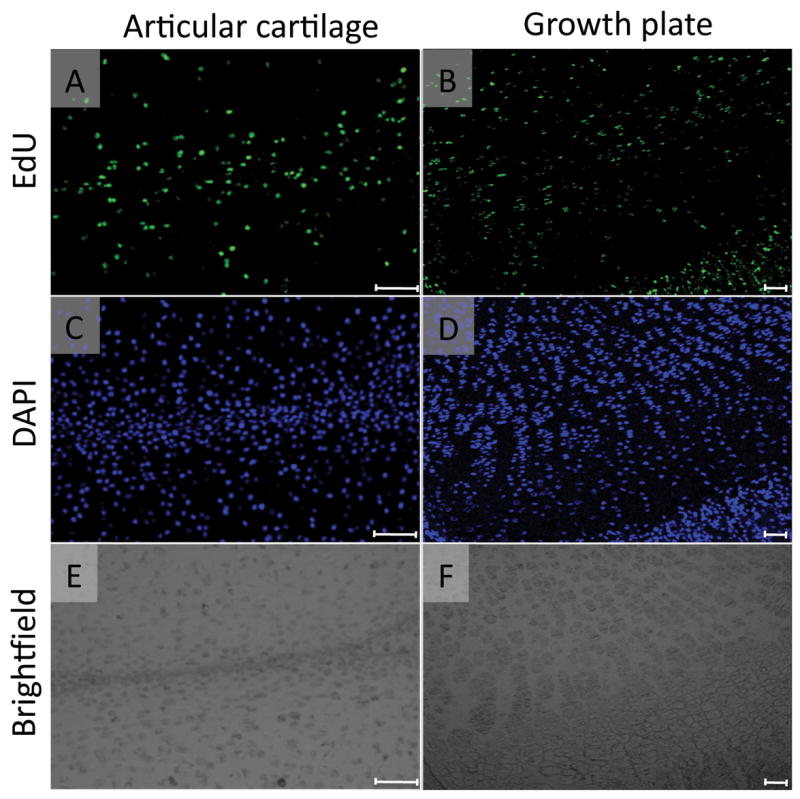
The mice received 4 daily intraperitoneal injections of EdU (5-ethynyl-2’-deoxyuridine, 5 μg/10 μl/ mouse) from postnatal day 4 and were sacrificed on the next day. The paraffin sections of articular cartilage and growth plate in the medial tibial plateau were subjected to EdU (A and B) and DAPI nuclear (C and D) staining. A large number of the cells in articular cartilage (A-C) and growth plate (B-D) were EdU-labeled. E and F are the brightfield images of A and B, respectively. Scale bars represent 50 μm for A, C and E, 100 μm for B, D and F.
FIGURE 2. EdU-labeled cells in the knee joints 6 weeks after the last EdU injection.
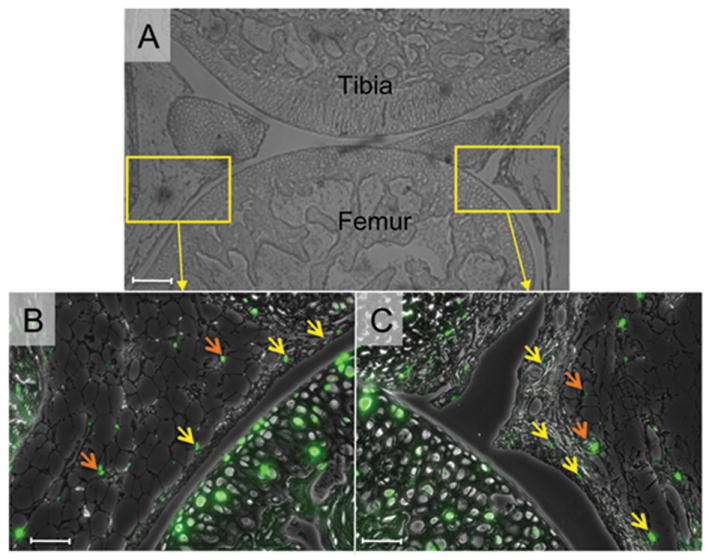
Six weeks after the last EdU injection at P7, the knee joints were harvested and subjected to EdU staining. The EdU fluorescence images (green) were superimposed to the phase contrast images. A, Low magnification image of the knee joint. B and C, a small number of EdU-labeled cells were detected in the synovium (yellow arrows) and fat pad (orange arrows). Scale bars represent 50 μm.
Distribution of EdU labeled cells in articular cartilage and growth plate
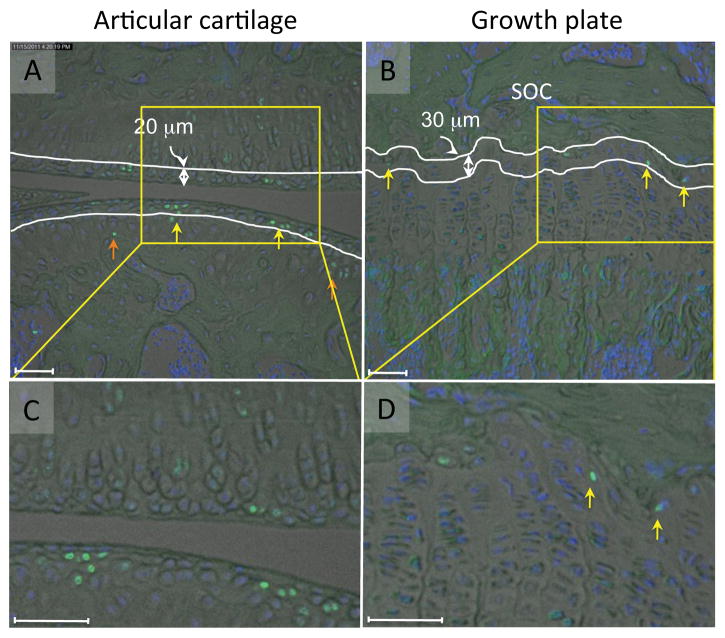
In articular cartilage at the 6-week time point, the labeled cells were present in the superficial and transitional zones (Figs. 3A and C and S-Fig.2A, yellow arrows), and also in middle and deep zones (Figs. 3A and C and S-Fig.2A, orange arrow). To quantify their respective numbers, we grouped together the superficial and transitional zones into a “surface region” covering approximately 20 μm of tissue thickness, but considered the middle and deep zones individually (Fig. 3A). The number of labeled cells relative to overall cell number per given area -the EdU labeling index- was then determined by computer-assisted image analysis. At 1 day after the last EdU injection, the index was about 41-46 % in the surface and remaining regions (Fig. 4, lanes 1 and 3). At the 6-week time point, the index in the surface region dropped to 22% (Fig. 4, lane 2) while it was 12% in the rest region (Fig. 4, lane 4) and significantly lower than the value of the surface region.
FIGURE 3. EdU-labeled cells in articular cartilage and growth plate 6 weeks after the last EdU injection.
The EdU fluorescence images (green) in articular cartilage (A, C) and growth plate (B and D) were superimposed to the brightfiled and the DAPI nuclear staining images (Blue) six weeks after the last EdU injection at P7. A and C, The EdU labeled cells were detected in the surface region (yellow arrows) and the rest region (orange arrows). White lines represent 20 μm from the edge of the articular cartilage (A). B and D, In the growth plate most of the EdU positive cells were found in the top layer of the growth plate (yellow arrows) that faced to the secondary ossification center (SOC) and marked by two white lines (B). Scale bars represent 50 μm.
FIGURE 4. Quantification of EdU-labeled cells in articular cartilage and growth plate.
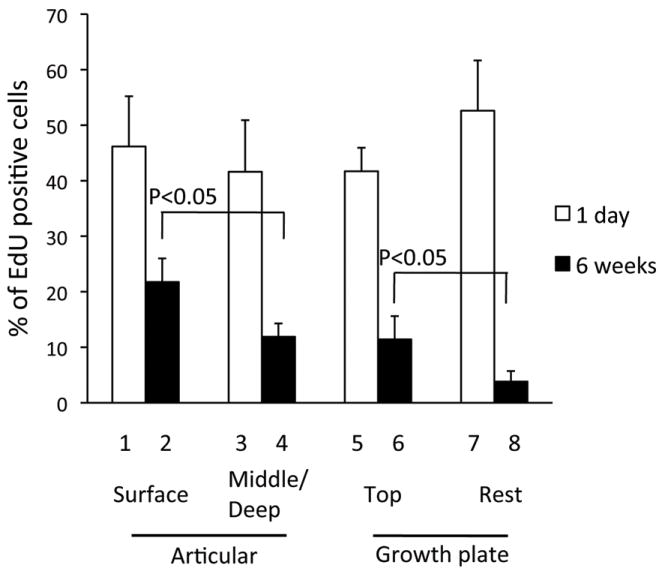
The EdU labeling index was calculated in the tibia sections 1 day and 6 weeks after the last EdU injection at P7. The articular cartilage was divided into the surface region (lanes 1 and 2) and the rest (lanes 3 and 4). The growth plate was divided into the top layer (lanes 5 and 6) and the rest (lanes 7 and 8). Values represent the average and standard deviation from analysis of two-three fields/slide, three slides/mouse and three mice/group.
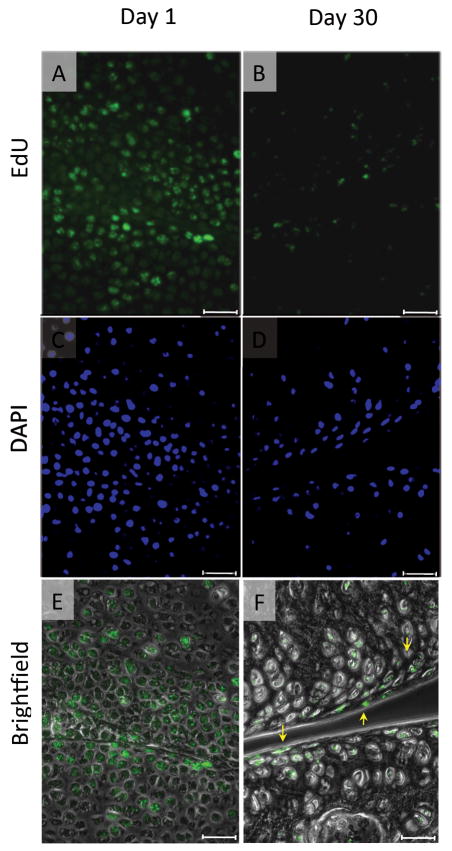
Our data showed that the EdU-retaining cells were dominant in the articular surface, but also existed in the other zones. There was a possibility that the EdU-labeled cells in articular cartilage may not divide enough and retain a detectable level of the EdU content because the cells have already acquired the phenotype of articular chondrocytes at the labeling time and do not actively proliferate and/or are not replaced. To label the cells at an earlier time point, we performed the EdU labeling at the embryonic stage (E12.5-E15.5). The knee joint formation starts at embryonic day 12 and the major components are established by embryonic day 15 in mice. We first examined localization of the EdU-labeled cells in the epiphyseal cartilage in the delivered pups at postnatal day 1, and found that the labeled cells were evenly distributed in the epiphysis, including the articular surface (Fig. 5A). The number of EdU-labeled cells decreased and dominantly found in only the articular surface at postnatal day 15 (data not shown). This tendency was clear at postnatal day 30 (Fig. 5B). However, we also observed the labeled cells in the deeper zone as well, which is consistent with the conditions of postnatal EdU labeling (Fig. 3A).
FIGURE 5. EdU-labeled cells in articular cartilage after the embryonic labeling.
The pregnant mice received daily intraperitoneal injection of EdU (250 μg/100 μl) 4 times from 12 days to 15 days post conception. The pups were then sacrificed at postnatal day 1 (A) or day 30 (B), and their knee joints were harvested. The EdU fluorescence images (A and B) are superimposed to the phase contrast images (E and F). C and D are DAPI nuclear staining images correspond to A and B, respectively. Scale bars represent 50 μm.
In the growth plate at 6 weeks, most EdU positive cells were restricted to the top layer that faces to the secondary ossification center (SOC) (Figs. 3B and D and, S-Fig. 2B, yellow arrows). We defined that top layer as a region about 30 μm in height and containing 2 to 3 cell layers (Fig. 3B). The overall EdU labeling index was initially 41-52% 1 day after the last injection (Fig. 4, histograms 5 and 7). By 6 weeks, it was about 11.4% in the top layer, while it had dropped to about 3.8% in the remainder of the growth plate (Fig. 4, lane 6 vs lane 8). These results indicate that cells in articular cartilage and growth plate display differential cell dynamics and persistence over time and location.
Loss of EdU-labeled cells in growth plate by β-catenin deficiency
The Wnt/β-catenin signaling pathway plays essential roles in regulation of skeletal and cartilage development and growth1,14-17. We have previously shown that postnatal β-catenin deficiency causes abnormalities in articular cartilage and the growth plate17 and reduces the number of slow-cycling cells in articular cartilage19. Thus we tested here whether the distribution and number of slow- cycling cells were affected in the growth plate as well following β-catenin deficiency. Col2CreER;β-cateninf/f mice received intraperitoneal injections of tamoxifen (at P4 and P6) and EdU (from P4 to P7). Four weeks after the last tamoxifen injection, the long bones were shortened and deformed in the mutant mouse (S-Fig. 3). Histological examination revealed that the mutant growth plate, especially the resting and prehypertrophic zones increased in height (Fig. 6B, arrowed line) and showed irregular cell alignment (Fig. 6B) compared to growth plates in control tamoxifen-injected control β-cateninf/f mice (Fig. 6A). The cells in mutant growth plates were also larger and sparser (Fig. 6B) while cells in controls exhibited their typical flat shape and were aligned in columns (Fig. 6A). Expression of collagen 10, a marker of hypertrophic chondrocytes, was decreased in mutant Col2CreER;β-cateninf/f growth plate. Further the collagen 10-positive hypertrophic zone was narrowed, but cell morphology in hypertrophic cells was not affected significantly (Fig. 6D), indicating that β-catenin signaling may not be directly involved in regulation of morphological change of cell hypertrophy. Twelve weeks after the last tamoxifen injection, the mutant growth plates became severely disorganized (Fig. 6F) and had retained minimal if any columnar cell organization (Fig. 6H) that was well appreciable in controls (Figs. 6E and G). These findings indicate that conditional β-catenin deficiency leads to dysfunction of growth plate chondrocytes, including inhibition of hypertrophy and derangement of cell alignment.
FIGURE 6. Effects of conditional ablation of β-catenin on cell alignment and collagen 10 expression in growth plate.
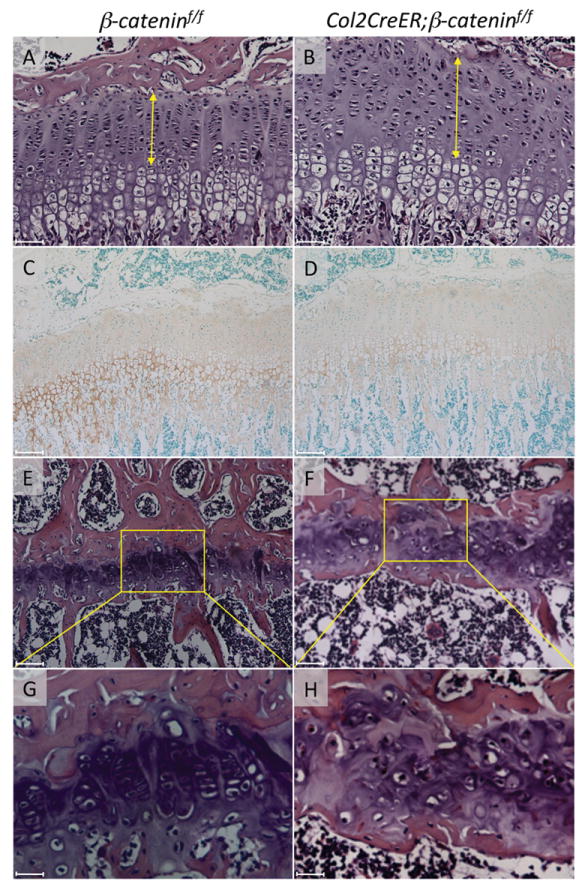
The knee joints were harvested from β-cateninf/f (A, C, E, G) and Col2CreER; β-cateninf/f (B, D, F, H) mice 4 weeks (A-D) and 12 weeks (E-H) after tamoxifen injections. The tibia sections were subjected to hematoxylin/eosin staining (A, B, E-H) and immunostaining for collagen 10 (C and D). The yellow arrows indicate the height of resting, proliferating and prehypertrophic zones of growth plate. Scale bars represent 50 μm for A, B, E, F, 100 μm for C and D, and 12.5 mm for G and H.
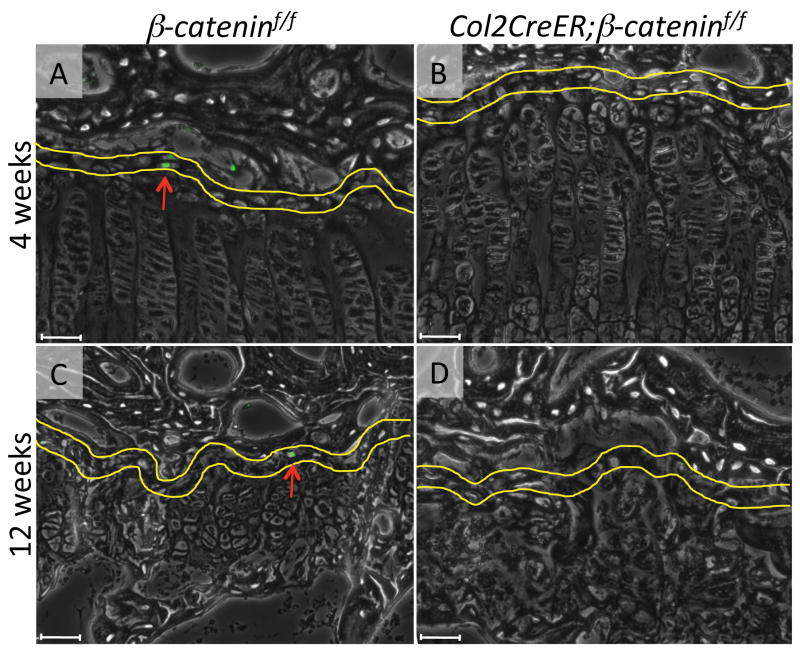
We did not find significant difference in distribution and number of the EdU-labeled cells in articular cartilage and growth plates in between β-cateninf/f and Col2CreER;β-cateninf/f groups (S-Fig. 4) 1 day after the last EdU injection. Strikingly, 4 weeks after the last tamoxifen and EdU injection, there were hardly any EdU-labeled cells in mutants, including the top layer in the growth plate (Fig. 7B), while the cells were readily observable in that the same location in control mice (Fig. 7A). After twelve weeks, the control growth plate still contained EdU-labeled cells in the top layer (Fig. 7C, arrow) while that in the mutants completely lost EdU-labeled cells (Fig. 7D). Quantification of the EdU labeling index confirmed this observation (Fig. 8).
FIGURE 7. Absence of EdU-labeled cells in the β-catenin-deficient growth plate.
EdU staining of tibial growth plate in β-cateninf/f (A, C) and Col2CreER; β-cateninf/f (B, D) mice 4 weeks (A, B) and 12 weeks (C, D) after the last EdU injection. Yellow lines indicate the top layer (30 μm in height) of growth plate and the red arrows indicate the EdU positive cells. Scale bars represent 50 μm.
FIGURE 8. Quantification of EdU-labeled cells in β-catenin-deficient growth plate.
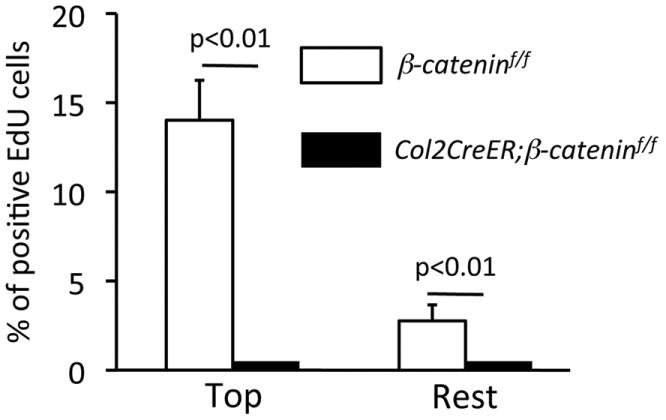
The EdU labeling index was calculated in the tibial growth plate of β-cateninf/f and Col2CreER;β-cateninf/f mice 4 weeks after the last EdU injection. Values represent the average and standard deviation from analysis of two-three fields/slide, three slides/mouse and three mice/group.
Discussion
Our data provide clear evidence that slow-cycling cells reside at specific locations in growing long bones and synovial joints, and specifically in the top narrow reserve zone of the growth plate below the secondary ossification center and in the surface region of articular cartilage. We also show for the first time that conditional ablation of β-catenin in cartilage causes a loss of those cells in the growth plate. The data fit well with well establish evidence that the β-catenin signaling pathway is essential for normal skeletal development and growth10-13, and our data assign one more key role to this pathway in the maintenance of slow-cycle cells in growth plate. It is important to point out here that the chemical reaction-based method that we used here increased the detection sensitivity and specificity, and allowed us to generate very clear and unequivocal images and data and thereby to reach solid conclusions.
Chondroprogenitors in the epiphyseal cartilage
Ohlsson et al.4 has made use of tritiated thymine injections to trace and track long-lived cells in rats. They administrated the tritiated thymidine starting at embryonic stage or 18 days of age and determined the distribution of labeled cells 2 to 4 weeks after isotope administration was stopped. In long bones, the labeled cells were found in the proximal portion of growth plate, the perichondrial ring and the surface of articular cartilage, and the labeling rates ranged from 10 to 29%. In general, our results are consistent with those original findings at least in terms of overall localization and prevalence of the cells and their prevalence. More recently, pulse-chase studies using non-isotope nucleoside derivatives found that slow-cycling cells are present in synovium20 and zone of Ranvier6 in mice and rabbits. These data also fit our observation of EdU-labeled cells in those locations, but we also observed labeled cells in infrapatella fat pad and ligament attachment sites. All the regions where we detect EdU-labeled cells are widely thought to contain stem/progenitor cells that may provide newly-differentiated chondrocytes to growth plate and articular cartilage3,6,20,21 for self-renewal or repair, and/or show multipotency in vitro including chondrogenic differentiation21-24.
It has been long know that the growth plate contains a top resting zone containing round and solitary cells that divide infrequently25 and retain 3H-thymidine labeling for protracted time4. This zone is considered to contain progenitor cells that provide chondrocytes to growth plate, and thereby called a germinal layer or reserve zone3. Our results suggest that slow-cycle cells actually reside in a very narrow layer within this zone and are localized intimately close to the secondary ossification. It is thus possible that the cells may reach that location from bone marrow or circulation, and such location may provide with a specialized microenvironment or niche crucial to their long term maintenance, survival and function. Ongoing studies using double labeling methods with nucleoside derivatives and immunostaining for stem/progenitor cell markers should provide for a better understanding of the specific potentials of these cells and the extent to which they normally participate in tissue homeostasis or can be mobilized following experimental insults.
Wnt/β-catenin signaling in growth plate
The Wnt/β-catenin signaling pathway plays essential roles in regulation of normal cartilage development, maintenance of permanent cartilage, and growth plate function1,14-17. In vivo and in vitro studies have revealed that this signaling elicits specific actions on chondrocytes, including inhibition of chondrogenic differentiation, stimulation of maturation and terminal differentiation, stimulation of cell proliferation directly or indirectly and regulation of apoptosis17,26-31. As pointed out above, our data add a new action to this list, specifically maintenance of slow-cycling cells in the growth plate. By 4 weeks following β-catenin ablation in chondrocytes, the cells were no longer detectable in growth plate. At the same time, the mutant growth plate exhibited mild disorganization of columnar alignment of chondrocytes, and was also deformed and bended toward the metaphysis as we reported recently32. It remains to be determined whether the loss of slow-cycle cells is directly linked to irregularity of columnar structure and/or deformation of the growth plate. If loss of β-catenin signaling accelerates the transition of progenitor cells to differentiated chondrocytes, then an excess number of chondrocytes would be provided to the growth plate, resulting in an un-physiologic expansion of growth plate, disorganization of chondrocyte alignment and eventually deformation of the growth plate. Alternatively, the loss of β-catenin signaling could impair the survival of slow cell-cycle cells; as a consequence, the growth plate would not receive a normal complement of newly differentiated chondrocytes, resulting in abnormalities in columnar organization and long bone elongation. More experiments are needed to test this possibility and other aspects of Wnt/β-catenin signaling that may have all contributed to elicit the severe phenotype.
In conclusion, our data provide very clear evidence for the presence, distribution and long term maintenance of slow cycle cells in articular cartilage and growth plate and the essential role of β-catenin. The data also demonstrate how powerful, sensitive and specific our analytical procedures for slow cycling cell monitoring are. Much remains unclear about the roles of these cells in articular cartilage and growth plate organization, homeostasis and repair, but it is quite likely that such understanding could pave the way to mobilize and activate the cells to therapeutically enhance self-renewal and regeneration of articular cartilage and restructuring of the growth plate in conditions such as osteoarthritis and skeletal dysplasias.
Supplementary Material
Acknowledgments
We thank Dr. Susan Mackem (National Cancer Institute) for providing us the Col2CreERT mice, Dr. Kengo Shimono (Okayama University) for advice, Mr. Wei-en Tung, Ms. Cheri Saunders and Christine Macolino for technical assistance. This study is supported by NIH Grants AR062908 (MEI/MP), AR061758 (EK/MP) and AR046000 (MI/MP).
References
- 1.Koyama E, Shibukawa Y, Nagayama M, et al. A distinct cohort of progenitor cells participates in synovial joint and articular cartilage formation during mouse limb skeletogenesis. Dev Biol. 2008;316:62–73. doi: 10.1016/j.ydbio.2008.01.012. [DOI] [PMC free article] [PubMed] [Google Scholar]
- 2.Hyde G, Dover S, Aszodi A, et al. Lineage tracing using matrilin-1 gene expression reveals that articular chondrocytes exist as the joint interzone forms. Dev Biol. 2007;304:825–833. doi: 10.1016/j.ydbio.2007.01.026. [DOI] [PMC free article] [PubMed] [Google Scholar]
- 3.Brighton CT. Structure and function of the growth plate. Clin Orthop Relat Res. 1978:22–32. [PubMed] [Google Scholar]
- 4.Ohlsson C, Nilsson A, Isaksson O, et al. Growth hormone induces multiplication of the slowly cycling germinal cells of the rat tibial growth plate. Proc Natl Acad Sci U S A. 1992;89:9826–9830. doi: 10.1073/pnas.89.20.9826. [DOI] [PMC free article] [PubMed] [Google Scholar]
- 5.Tonna EA. The cellular complement of the skeletal system studied autoradiographically with tritiated thymidine (H3TDR) during growth and aging. J Biophys Biochem Cytol. 1961;9:813–824. doi: 10.1083/jcb.9.4.813. [DOI] [PMC free article] [PubMed] [Google Scholar]
- 6.Karlsson C, Thornemo M, Henriksson HB, et al. Identification of a stem cell niche in the zone of Ranvier within the knee joint. J Anat. 2009;215:355–363. doi: 10.1111/j.1469-7580.2009.01115.x. [DOI] [PMC free article] [PubMed] [Google Scholar]
- 7.Hunziker EB, Kapfinger E, Geiss J. The structural architecture of adult mammalian articular cartilage evolves by a synchronized process of tissue resorption and neoformation during postnatal development. Osteoarthritis Cartilage. 2007;15:403–413. doi: 10.1016/j.joca.2006.09.010. [DOI] [PubMed] [Google Scholar]
- 8.Larouche D, Lavoie A, Paquet C, et al. Identification of epithelial stem cells in vivo and in vitro using keratin 19 and BrdU. Methods Mol Biol. 2010;585:383–400. doi: 10.1007/978-1-60761-380-0_27. [DOI] [PubMed] [Google Scholar]
- 9.Salic A, Mitchison TJ. A chemical method for fast and sensitive detection of DNA synthesis in vivo. Proc Natl Acad Sci U S A. 2008;105:2415–2420. doi: 10.1073/pnas.0712168105. [DOI] [PMC free article] [PubMed] [Google Scholar]
- 10.Faigle R, Song H. Signaling mechanisms regulating adult neural stem cells and neurogenesis. Biochim Biophys Acta. 2013;1830:2435–2448. doi: 10.1016/j.bbagen.2012.09.002. [DOI] [PMC free article] [PubMed] [Google Scholar]
- 11.von Maltzahn J, Chang NC, Bentzinger CF, et al. Wnt signaling in myogenesis. Trends Cell Biol. 2012;22:602–609. doi: 10.1016/j.tcb.2012.07.008. [DOI] [PMC free article] [PubMed] [Google Scholar]
- 12.Schuijers J, Clevers H. Adult mammalian stem cells: the role of Wnt, Lgr5 and R-spondins. Embo J. 2012;31:2685–2696. doi: 10.1038/emboj.2012.149. [DOI] [PMC free article] [PubMed] [Google Scholar]
- 13.Ling L, Nurcombe V, Cool SM. Wnt signaling controls the fate of mesenchymal stem cells. Gene. 2009;433:1–7. doi: 10.1016/j.gene.2008.12.008. [DOI] [PubMed] [Google Scholar]
- 14.Hartmann C. Skeletal development--Wnts are in control. Mol Cells. 2007;24:177–184. [PubMed] [Google Scholar]
- 15.Day TF, Yang Y. Wnt and hedgehog signaling pathways in bone development. J Bone Joint Surg Am. 2008;90(Suppl 1):19–24. doi: 10.2106/JBJS.G.01174. [DOI] [PubMed] [Google Scholar]
- 16.Church VL, Francis-West P. Wnt signalling during limb development. Int J Dev Biol. 2002;46:927–936. [PubMed] [Google Scholar]
- 17.Yuasa T, Kondo N, Yasuhara R, et al. Transient activation of Wnt/{beta}-catenin signaling induces abnormal growth plate closure and articular cartilage thickening in postnatal mice. Am J Pathol. 2009;175:1993–2003. doi: 10.2353/ajpath.2009.081173. [DOI] [PMC free article] [PubMed] [Google Scholar]
- 18.Nakamura E, Nguyen MT, Mackem S. Kinetics of tamoxifen-regulated Cre activity in mice using a cartilage-specific CreER(T) to assay temporal activity windows along the proximodistal limb skeleton. Dev Dyn. 2006;235:2603–2612. doi: 10.1002/dvdy.20892. [DOI] [PubMed] [Google Scholar]
- 19.Yasuhara R, Ohta Y, Yuasa T, et al. Roles of beta-catenin signaling in phenotypic expression and proliferation of articular cartilage superficial zone cells. Lab Invest. 2011;91:1739–1752. doi: 10.1038/labinvest.2011.144. [DOI] [PMC free article] [PubMed] [Google Scholar]
- 20.Kurth TB, Dell’accio F, Crouch V, et al. Functional mesenchymal stem cell niches in adult mouse knee joint synovium in vivo. Arthritis Rheum. 2011;63:1289–1300. doi: 10.1002/art.30234. [DOI] [PubMed] [Google Scholar]
- 21.Seol D, McCabe DJ, Choe H, et al. Chondrogenic progenitor cells respond to cartilage injury. Arthritis Rheum. 2012;64:3626–3637. doi: 10.1002/art.34613. [DOI] [PMC free article] [PubMed] [Google Scholar]
- 22.Dowthwaite GP, Bishop JC, Redman SN, et al. The surface of articular cartilage contains a progenitor cell population. J Cell Sci. 2004;117:889–897. doi: 10.1242/jcs.00912. [DOI] [PubMed] [Google Scholar]
- 23.Fossett E, Khan WS, Longo UG, et al. Effect of age and gender on cell proliferation and cell surface characterization of synovial fat pad derived mesenchymal stem cells. J Orthop Res. 2012;30:1013–1018. doi: 10.1002/jor.22057. [DOI] [PubMed] [Google Scholar]
- 24.Horie M, Driscoll MD, Sampson HW, et al. Implantation of allogenic synovial stem cells promotes meniscal regeneration in a rabbit meniscal defect model. J Bone Joint Surg Am. 2012;94:701–712. doi: 10.2106/JBJS.K.00176. [DOI] [PMC free article] [PubMed] [Google Scholar]
- 25.Belanger LF, Migicovsky BB. Bone cell formation and survival in H3-thymidine-labeled chicks under various conditions. Anat Rec. 1963;145:385–390. doi: 10.1002/ar.1091450303. [DOI] [PubMed] [Google Scholar]
- 26.Hartmann C, Tabin CJ. Wnt-14 plays a pivotal role in inducing synovial joint formation in the developing appendicular skeleton. Cell. 2001;104:341–352. doi: 10.1016/s0092-8674(01)00222-7. [DOI] [PubMed] [Google Scholar]
- 27.Day TF, Guo X, Garrett-Beal L, et al. Wnt/beta-catenin signaling in mesenchymal progenitors controls osteoblast and chondrocyte differentiation during vertebrate skeletogenesis. Dev Cell. 2005;8:739–750. doi: 10.1016/j.devcel.2005.03.016. [DOI] [PubMed] [Google Scholar]
- 28.Enomoto-Iwamoto M, Kitagaki J, Koyama E, et al. The Wnt antagonist Frzb-1 regulates chondrocyte maturation and long bone development during limb skeletogenesis. Dev Biol. 2002;251:142–156. doi: 10.1006/dbio.2002.0802. [DOI] [PubMed] [Google Scholar]
- 29.Zhu M, Tang D, Wu Q, et al. Activation of beta-Catenin Signaling in Articular Chondrocytes Leads to Osteoarthritis-Like Phenotype in Adult beta-Catenin Conditional Activation Mice. J Bone Miner Res. 2008;24:12–21. doi: 10.1359/JBMR.080901. [DOI] [PMC free article] [PubMed] [Google Scholar]
- 30.Chen M, Zhu M, Awad H, et al. Inhibition of beta-catenin signaling causes defects in postnatal cartilage development. J Cell Sci. 2008;121:1455–1465. doi: 10.1242/jcs.020362. [DOI] [PMC free article] [PubMed] [Google Scholar]
- 31.Dong YF, Soung do Y, Chang Y, et al. Transforming growth factor-beta and Wnt signals regulate chondrocyte differentiation through Twist1 in a stage-specific manner. Mol Endocrinol. 2007;21:2805–2820. doi: 10.1210/me.2007-0199. [DOI] [PubMed] [Google Scholar]
- 32.Cantley L, Saunders C, Guttenberg M, et al. Loss of beta-Catenin Induces Multifocal Periosteal Chondroma-Like Masses in Mice. Am J Pathol. 2012;182:917–927. doi: 10.1016/j.ajpath.2012.11.012. [DOI] [PMC free article] [PubMed] [Google Scholar]
Associated Data
This section collects any data citations, data availability statements, or supplementary materials included in this article.


