
Figure 1.
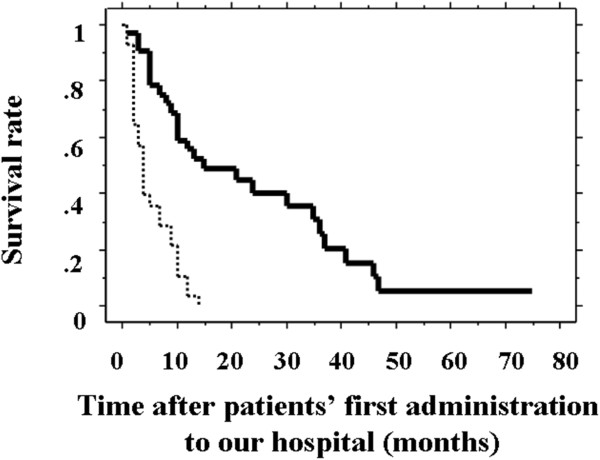
Survival curves of patients with a low- and high- score groups. The survival curve of 33 patients with low scores (score 0 and +1; solid line) was significantly higher than that for 28 patients with high scores (score +2, +3, and +4; dashed line; P < 0.001).