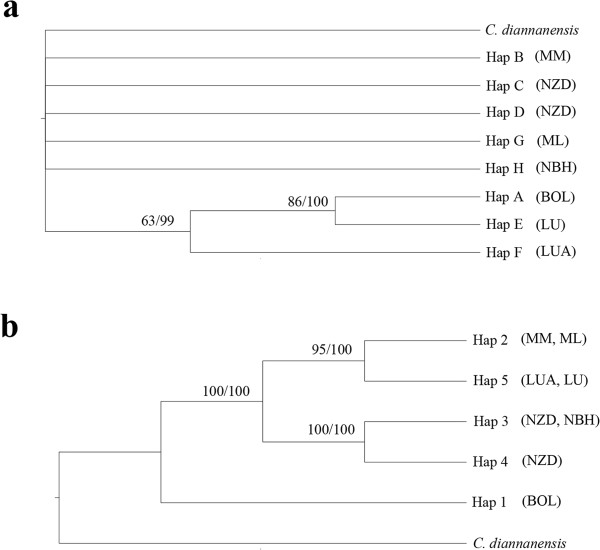
Figure 3.

Strict consensus tree obtained by analysis of eight cpDNA haplotypes (a) and five nrDNA haplotypes (b) of C. simplicipinna, with C. diannanensis used as the outgroup. The numbers on branches indicate bootstrap values from the Maximum Parsimony principle (left) and the Bayesian analysis (right). The symbols BOL-NBH in the bracket represent population codes.
