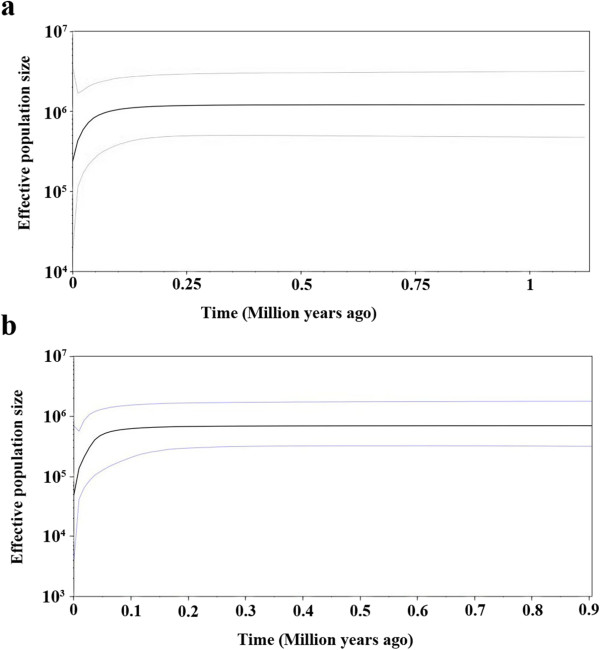
Figure 6.

Bayesian skyline plot based on cpDNA (a) and nrDNA (b) for the effective population size fluctuation throughout time. Black line: median estimation; area between gray lines: 95% confidence interval.

Bayesian skyline plot based on cpDNA (a) and nrDNA (b) for the effective population size fluctuation throughout time. Black line: median estimation; area between gray lines: 95% confidence interval.