
Figure 5.
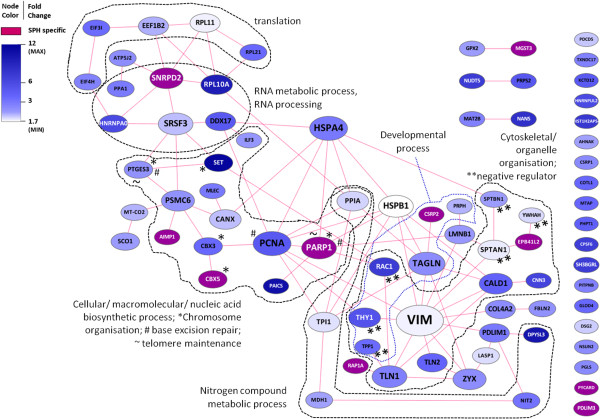
Network of up-regulated proteins (referenced by gene symbols) in all CRC-SPH pairs. Proteins up-regulated with a fold change > 1.5 in all three pairs of spheroids (SPH) versus their parent colorectal carcinoma tissue (CRC) were pre-screened with the BINGO gene ontology tool, and inflammatory/acute phase-related proteins were deleted from the list. The remaining proteins were uploaded to STRING, and the returned protein-protein link data were used to generate and annotate a protein network in Cytoscape. Nodes and their labels were sized according to the number of edges connected to them. Node color was made dependent on the overall fold change in all three CRC-SPH pairs: nodes exhibiting a defined fold change were colored along a white-to-blue gradient (minimum and maximum values indicated), whereas nodes only detected in SPH were colored purple, see color legend.