
Figure 3.
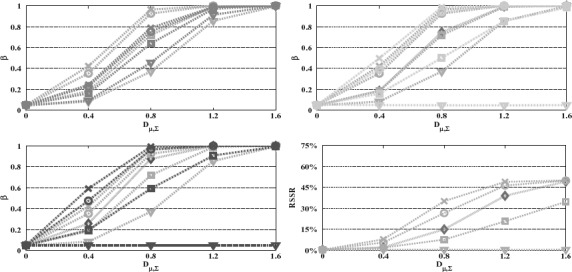
Power and RSSR versus Mahalanobis distance. We plot the z*-test (green ––) with the tests z+ (orange –.) (up left), sequential z (cyan −) and χ2 (magenta  ) (up right), single stage z (blue –) and χ2 (red
  ) (down left) and sequential χ2 (down right). The linear combination z*/z / z+ tests are performed with first stage/fixed/first step weighting vectors having 0 (×), 30° (○), 60° (□), and 90° (∇) angle to the optimal. The remaining design parameters are J = 2, K = 10, α = 0.05, α1,1 = 0.01, α0,1 = 1, nT = 30, r = 0.5, n0 = 0.75n1, ν0 = n0 − 1.