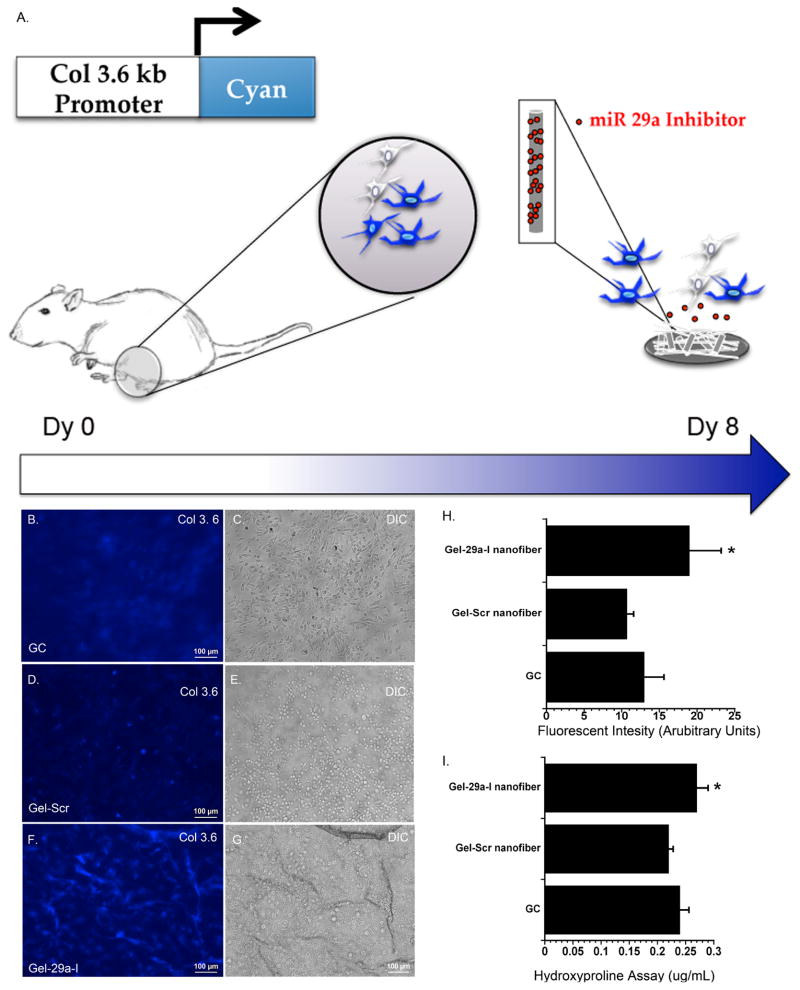
Figure 8. Col 3.6 cyan blue expression and collagen content from BMSCs seeded on scaffolds.
A.) Schematic of bone marrow stromal cultures isolated from femurs and tibia of pOBCol3.6 cyan blue mice following 8 days of culture. Fluorescence micrographs of cells cultured on B.) glass cover slips (GC), C.) gelatin nanofibers loaded with scramble D.) gelatin nanofibers loaded with miR-29a inhibitor. E, F and G are DIC images corresponding to the side panel (scale 100 μm). H.) Quantified fluorescence intensity. I.) Hydroxyproline content of cultures after 8 days of culture. (n=3; * p<0.05).

