
Fig. 5.
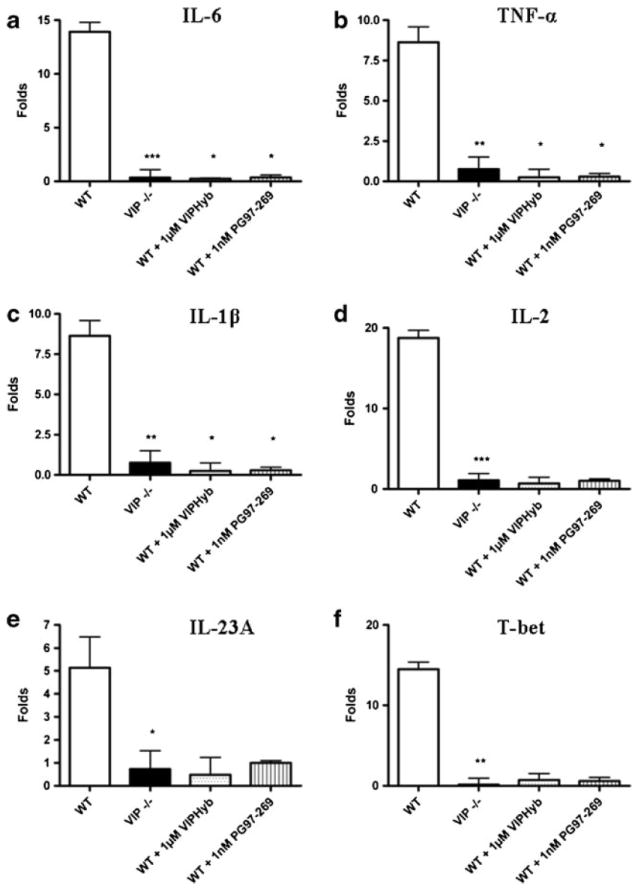
Cytokine profile, expressed as the ratio between the cytokine level in DSS-treated and untreated mice. Results are expressed as fold up- or down-regulation from controls. WT were compared to VIP−/− mice. Effect of attenuation of cytokine stimulation was evaluated in WT treated with either 1 μM VIPHyb, 1 nM PG 97–269, or vehicle. Cytokine levels of a IL-6, b TNF- α, c IL-1β, d IL-2, e IL-23A, and f T-bet were evaluated. Statistical analysis was performed using two-way ANOVA with Bonferroni post-test to calculate the p values. *p<0.05, **p<0.01, ***p<0.001