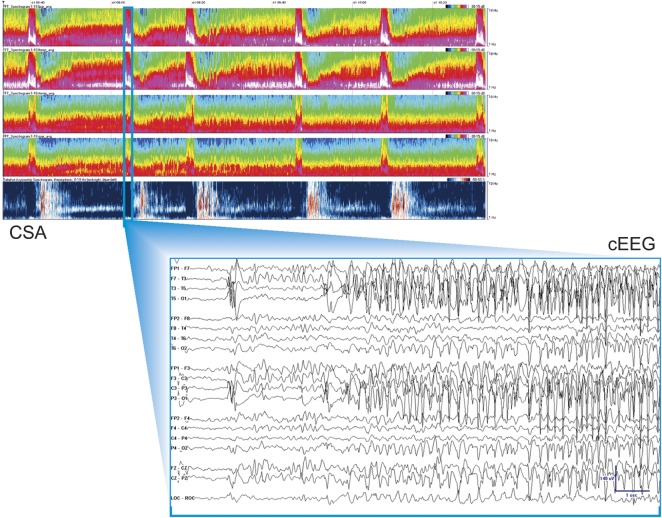
Figure 1. CSA display.
Top screen: Two-hour segments of CSA power data were displayed from top to bottom in a spectrogram montage. There are brief periods with increased power in the high-frequency band over the left hemisphere highlighting suspicious regions. Bottom screen: Raw cEEG data. cEEG = continuous EEG; CSA = compressed spectral array.

