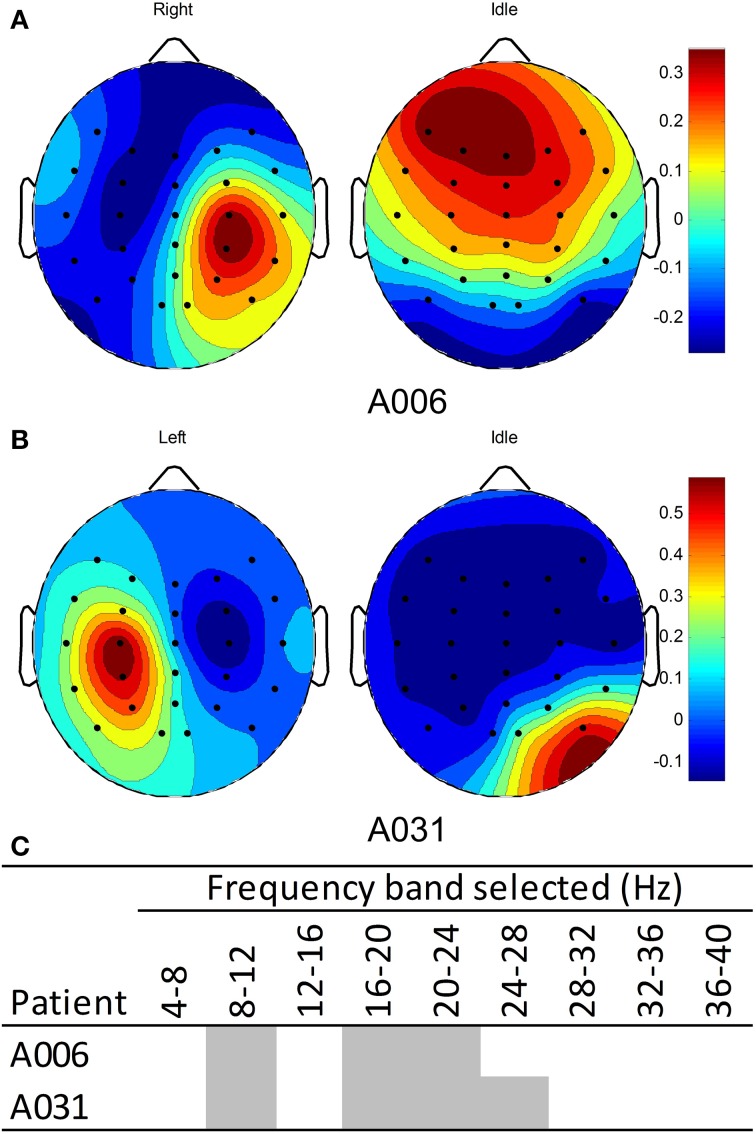
Figure 5.
EEG Spatial patterns and frequency bands used to classify motor imagery of stroke-impaired hand vs. idle condition. (A) Spatial patterns of patient A006 with right stroke-impaired hand; (B) spatial pattern of patient A031 with left stroke-impaired hand; (C) frequency bands used for patients A006 and A031. Blue and red colors in the spatial patterns correspond to negative (ERD) and positive (ERS) values respectively.

