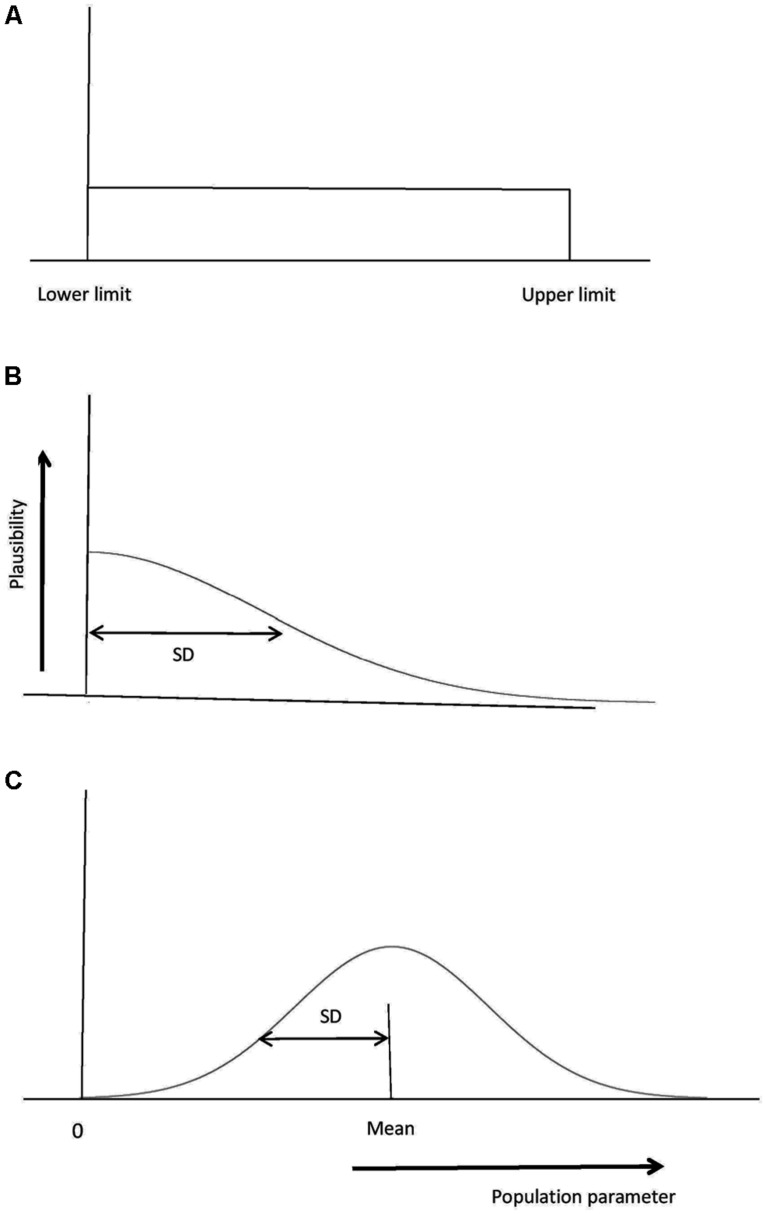
FIGURE 3.
Representing the alternative hypothesis. (A) A uniform distribution with all population parameter values from the lower to the upper limit equally plausible. Here the lower limit is 0, a typical but not required value. (B) A normal distribution, with population parameter values close to the mean being more plausible than others. The SD also needs to be specified; a default of mean/2 is often useful. (C) A half-normal distribution. Values close to 0 are most plausible; a useful default for the SD is a typical estimated effect size. Population values less than 0 are ruled out.

