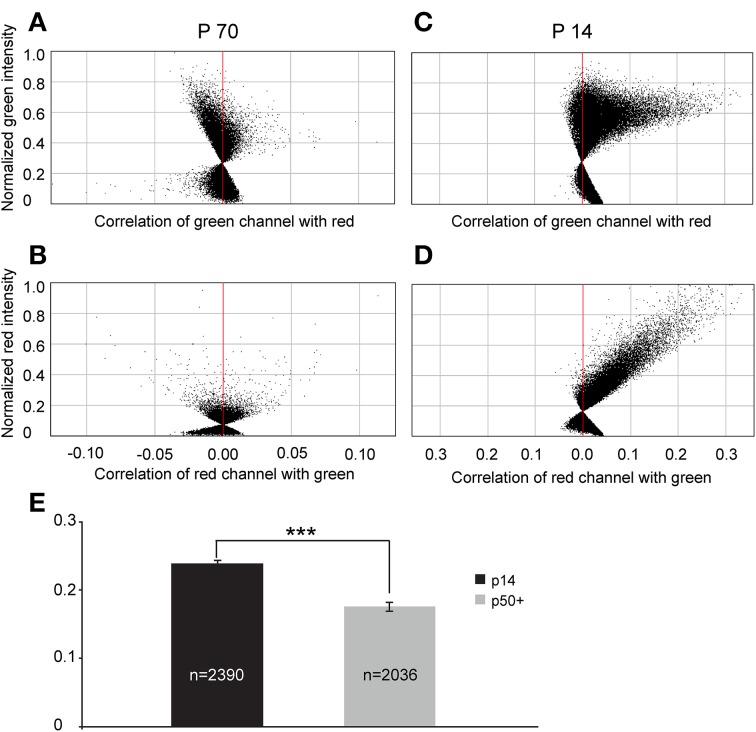
Figure 11.
Intrasomatic labeling against GAD67 in glycinergic VNTB neurons declines with age. (A–D) show pixel data from two single glycinergic VNTB neurons. Single glycinergic VNTB neurons were selected in a region of interest and analyzed for co-localization of signals in both channels. (A,B) display the normalized intensity correlation values of pixels in a p70 animal for the green and the red channel, respectively. Most of the values do not exceed the intensity correlation quotient (ICQ) range of −0.05 to 0.05 and are mostly distributed around the midline, indicating a largely uncorrelated or random distribution of overlapping green and red pixels (the resulting total ICQ was −0.001 in this case). By contrast, (C,D) show a strongly positive correlation of signals in the green and the red channels, respectively (with a resulting total ICQ value of 0.38 for this specific neuron). (E) Averaged total ICQ values for 2390 glycinergic VNTB neurons in p14 animals (black) and 2036 glycinergic VNTB neurons in p50+ (p59–70; gray) animals, respectively. ***p < 0.001 (Mann-Whitney rank-sum test).

