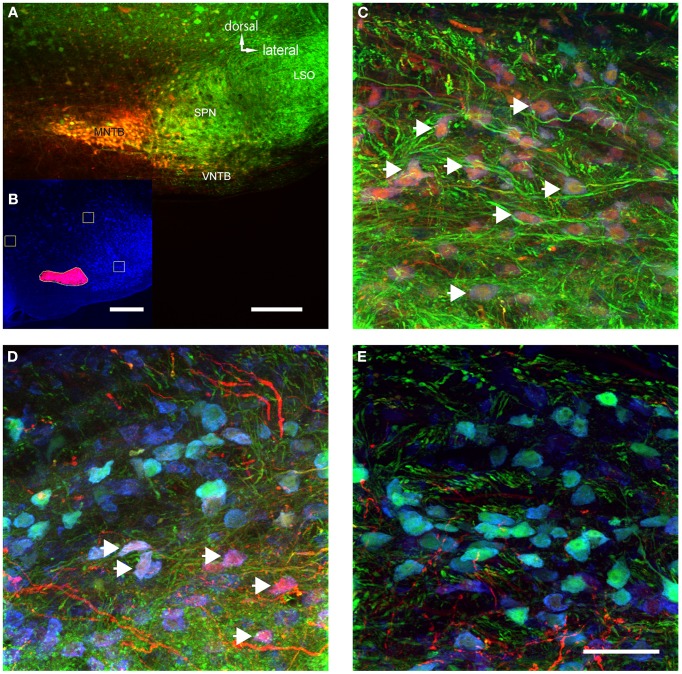
Figure 5.
The volume of TMR-injections into MNTB correlates with the number of labeled VNTB neurons. (A) A brain stem image showing a TMR-injected (red) MNTB. (B) The result of a semi-automatic analysis of the same injection with our custom-built MATLAB algorithm, illustrating the method of quantifying the apparent extent of the tracer injection. (C) Shows a section of VNTB from a brain where the tracer injection into the ipsilateral MNTB was extensive (65% of MNTB volume). (D) represents a section of VNTB from a brain where the tracer injection into the ipsilateral MNTB was moderate (5.5% of MNTB volume). (E) Represents a section of VNTB from a brain where the tracer injection into the ipsilateral MNTB was minimal (1.5% of MNTB volume). (A,C–E) are maximum projections of confocal stacks (image depth: 80 μm), (B) is based on an epifluorescence microscopy image taken at low magnification (10×). Scale bar for (A): 200 μm, for (B): 500 μm and (C–E): 50 μm.

