Figure 2.
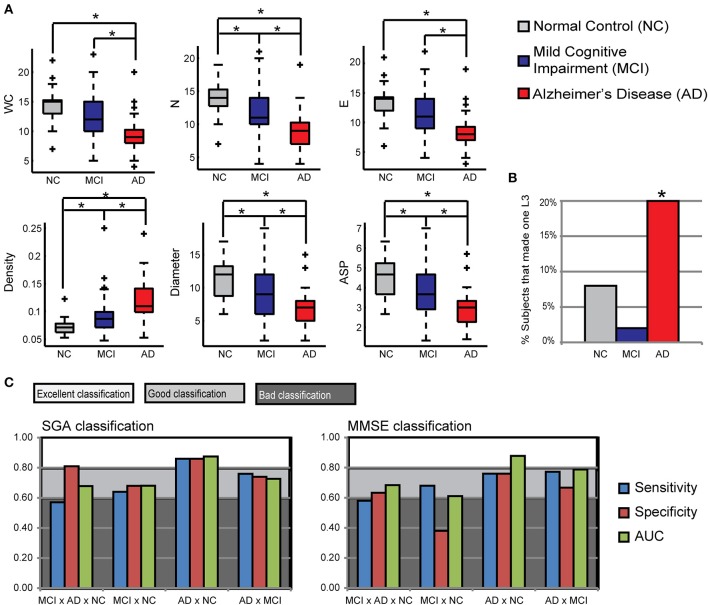
Speech Graph Attributes (SGA) differentiates psychopathological groups. (A) SGA boxplots with significant differences among Alzheimer Disorder (AD), Moderate Cognitive Impairment (MCI) and control groups (N = 25 on AD and C group, N = 50 on MCI group; Kruskal-Wallis test followed by two-sided Wilcoxon Rank-sum test with Bonferroni correction with alpha = 0.0167). (B) Percentage of subjects in each group that made one L3 on the verbal fluency test. AD subjects showed more L3 than MCI subjects (Wilcoxon Rank-sum test with Bonferroni correction with alpha = 0.0167, p = 0.0090). (C) Rating quality measured by AUC, sensitivity and specificity, using MMSE or SGA correlated with clinical symptoms measured with MMSE and Lawton scales (Table 3) (attributes: WC, N, E, Density, Diameter, and ASP). Notice that SGA was more specific than MMSE on triple group sorting, and on MCI diagnosis against the control group. *p = 0.0167.

