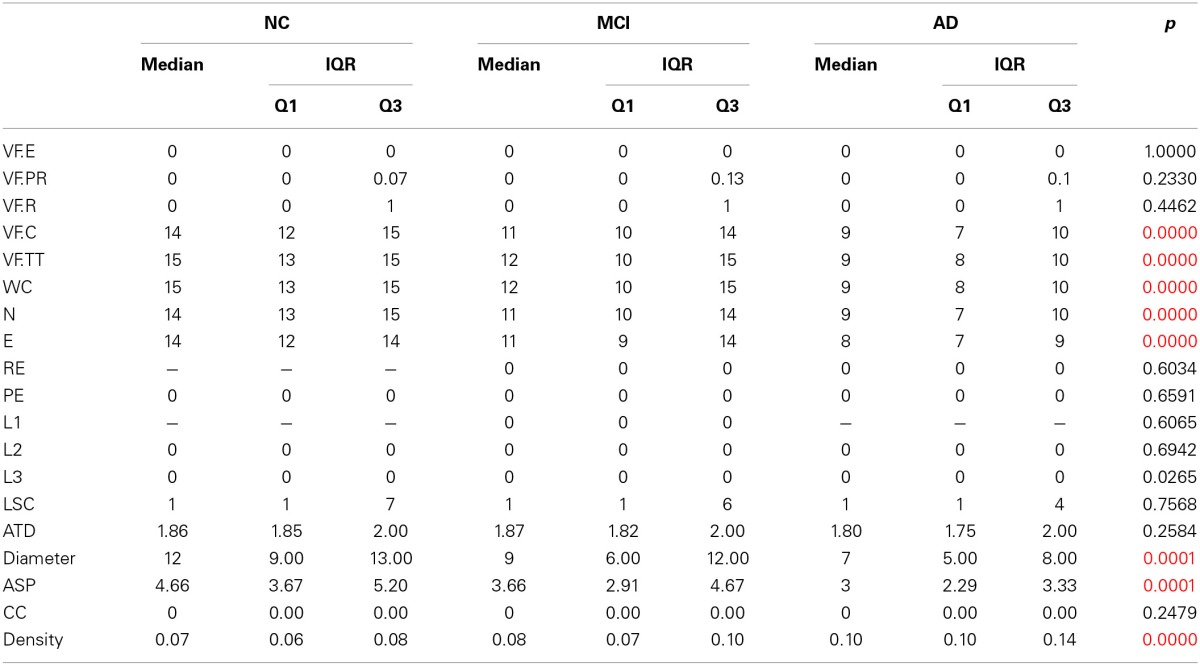
Table 2.
Verbal fluency and Speech Graph Attributes of NC, MCI, and AD groups, with Bonferroni-corrected significant differences across groups established by the Kruskal-Wallis comparison.

VF.E, errors; VF.PR, percentage of repetitions; VF.R, repetitions; VF.C, corrects words; VF.TT, total of words; WC, word count; N, nodes; E, edges; RE, repeated; PE, parallel edges; L1, L2, L3, cycles of one, two or 3 nodes; LSC, largest strongly connected component; ATD, average total degree; ASP, average shortest path; CC, clustering coefficient. Red values have significance p = 0.0167.
