
Table 6.
Additional description of socio-demographic data for the MCI subtypes, and the four groups comparison.
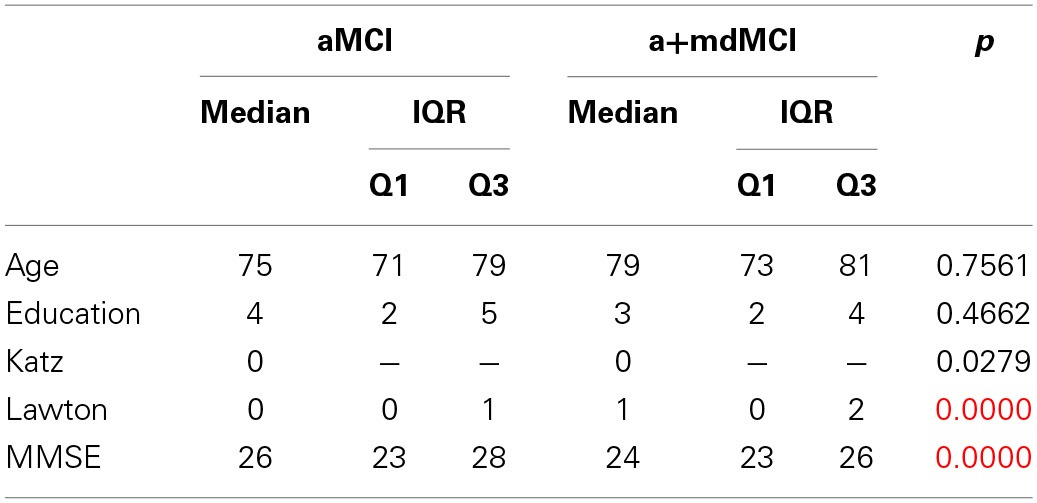
p* group comparison (NC; aMCI; a+mdMCI; AD). Red values have significance p = 0.0083.
Official websites use .gov
A
.gov website belongs to an official
government organization in the United States.
Secure .gov websites use HTTPS
A lock (
) or https:// means you've safely
connected to the .gov website. Share sensitive
information only on official, secure websites.
Additional description of socio-demographic data for the MCI subtypes, and the four groups comparison.
p* group comparison (NC; aMCI; a+mdMCI; AD). Red values have significance p = 0.0083.