
Table 7.
Additional description of verbal fluency and Speech Graph Attributes for the MCI subtypes, and the four groups comparison.
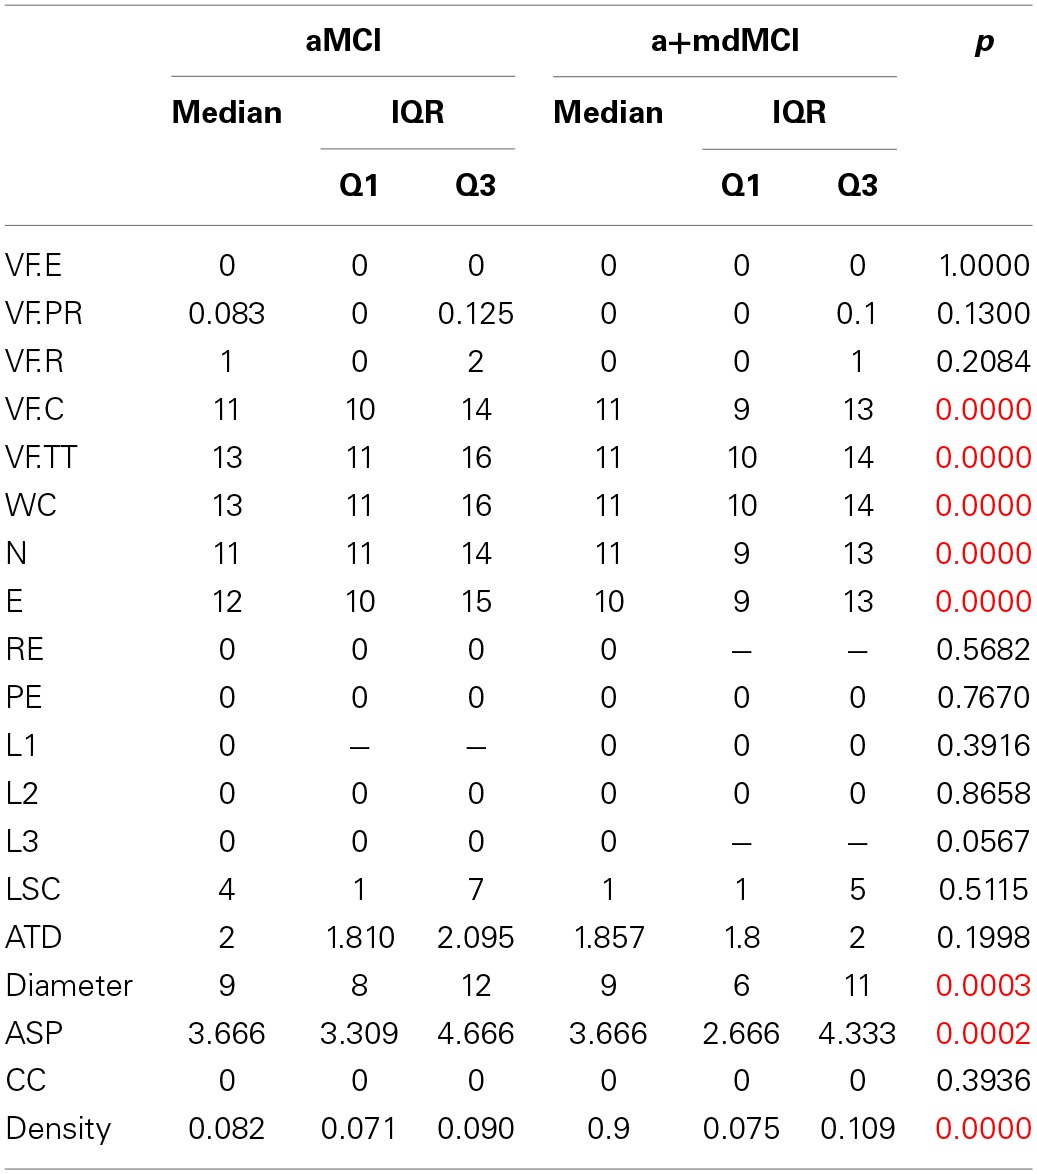
Red values have significance p = 0.0083.
Official websites use .gov
A
.gov website belongs to an official
government organization in the United States.
Secure .gov websites use HTTPS
A lock (
) or https:// means you've safely
connected to the .gov website. Share sensitive
information only on official, secure websites.
Additional description of verbal fluency and Speech Graph Attributes for the MCI subtypes, and the four groups comparison.
Red values have significance p = 0.0083.