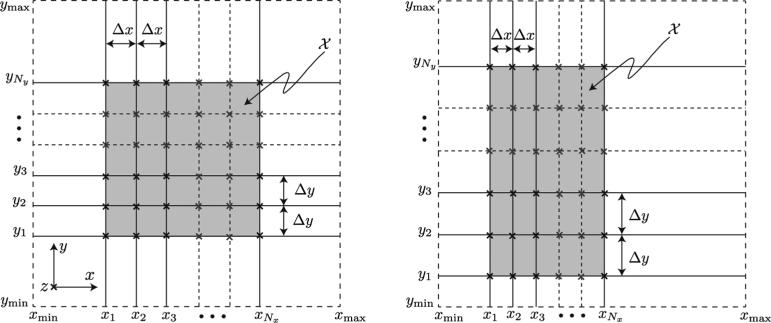
Fig. 3.
Spatial organization of the slices in the X- and Y- datasets for two different values of Θ = (x1, y1, Δx, Δy), where the origin (x1, y1)and spacing between slices Δx and Δy are only known approximately in the two 3D+time datasets and . The z-axis is perpendicular to the viewing plane and is indicated with a cross. Y-dataset , i = 1, 2, ..., Ny spans [xmin, xmax] and X-dataset , j = 1, 2, ..., Nx spans [ymin, ymax]. The slices from the two datasets intersect along lines parallel to z-axis (indicated with crosses). The shaded region indicates the domain .

