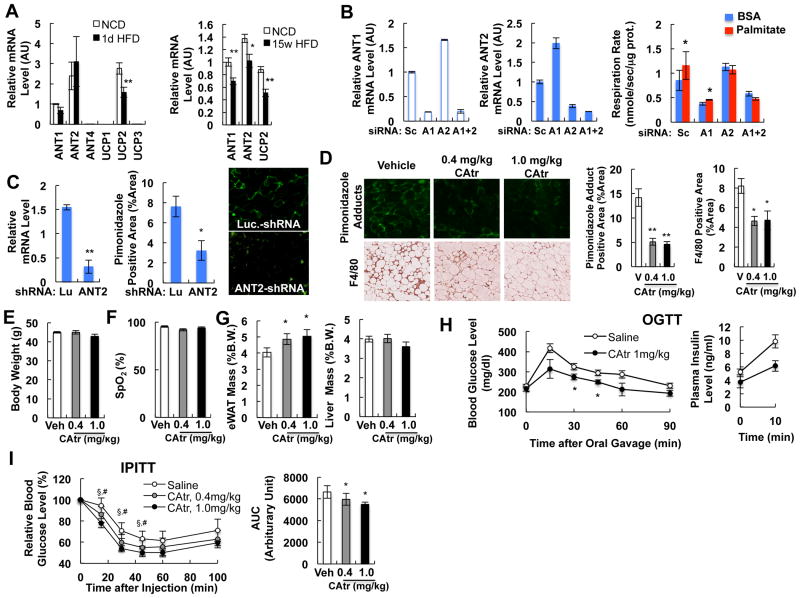
Figure 2.
Effects of ANT inhibition in obesity. (A) Expression of different isoforms of ANT and UCP genes in isolated primary eWAT adipocytes of chow or HFD mice at 1 day (left) or 15 weeks (right). *, P<0.05; **, P<0.01. (B) Effect of ANT1 or ANT2 knock down in 3T3-L1 adipocytes. 3T3-L1 adipocytes were transfected with scrambled siRNA (Sc) or siRNAs against ANT1(A1) or ANT2 (A2), or both (A1+2), and oxygen consumption rate was measured using Clark type electrode. *, P<0.05. (C) In vivo ANT2 knockdown decreases adipose tissue hypoxia. Green staining (middle panel) represents pimonidazole adduct-positive area. *, P<0.05; **, P<0.01. (D-I) Effect of chronic CAtr treatment on hypoxia (D), body weight (E), blood oxygenation (F), eWAT and liver weight (G), glucose tolerance (H) and insulin tolerance (I) at day 5-9. The graph shows body weight at day 5. *, P<0.05; **, P<0.01; § , P<0.05 0.4 mg/kg CAtr vs control; ; #, P<0.05 1.0 mg/kg CAtr vs control. See also Figure S2.

