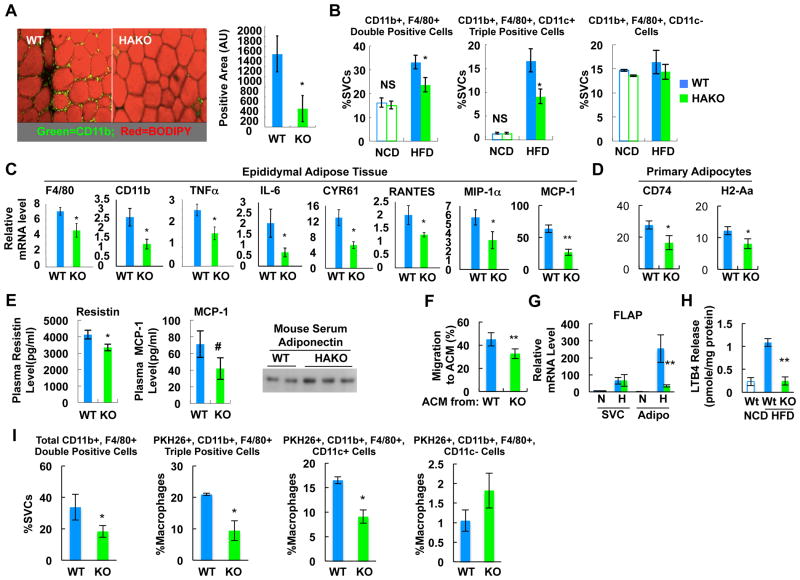
Figure 4.
HAKO mice exhibit reduced macrophage infiltration and inflammatory gene expression with reduced chemokine and LTB4 production. (A) IHC analysis of ATMs from WT or HAKO mice fed a HFD for 15 weeks. Red, neutral lipids (BODIPY); green, macrophage (CD11b). n=5 or 6 per group. (B) Flow cytometry analysis of eWAT SVCs from 15 week HFD mice. n=4 (NCD) or 7 (HFD) per group. (C) mRNA levels of inflammatory genes in adipose tissue were measured by RT-PCR analysis. n=6. (D) mRNA levels of class II MHC genes in primary adipocytes were measured by RT-PCR. n=7 per group. (E) Plasma levels of adipokines (n=7) as measured by ELISA or western blots. (F) Chemoattractive activity of ACM harvested from HAKO adipocytes is reduced compared with WT adipocytes (15 week HFD). n=4 per group. (G) FLAP mRNA level in adipocyte and SVC fractions of eWAT from mice fed NCD or HFD (15 weeks). n=7 or 9 per group. (H) LTB4 release from isolated adipocytes of NCD WT, HFD WT or HFD HAKO mice. n=3 or 7 per group. (I) In vivo monocyte tracking (n=4). All data represent mean+/-SEM. See also Figure S4.

