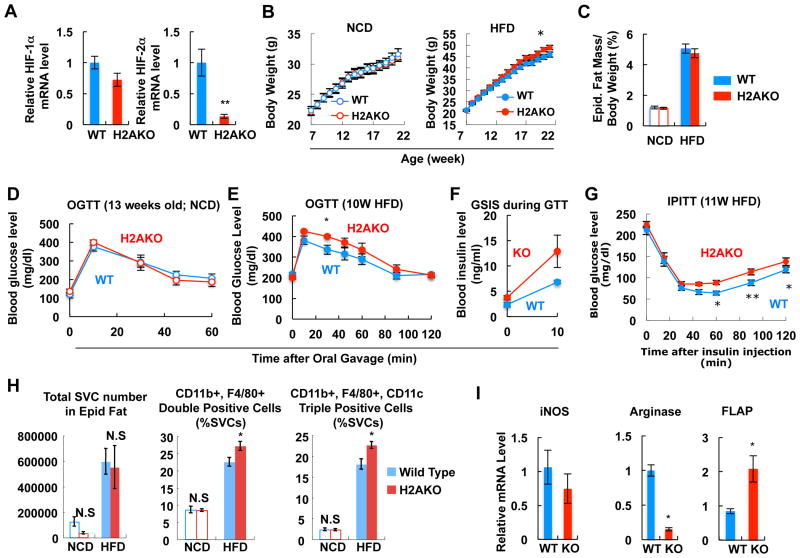
Figure 6.
H2AKO impairs glucose and insulin tolerance with increased adipose tissue inflammation. (A) mRNA levels of HIF-1α and HIF-2α in adipose tissue of HFD WT or H2AKO mice. n=6. (B) Body weight of WT and H2AKO mice fed NCD (n=10) or HFD (n=36). (C) eWAT mass on NCD and HFD (15 weeks; n=5 per group). (D) GTT in NCD mice. (E) GTT performed in 10 week HFD mice. (F) Plasma insulin level during GTT in panel E. (G) ITT test with mice on 11 week HFD. (H) Flow cytometry analysis of eWAT SVCs. n=4 or 9 per group. (I) RT-PCR analysis of inflammatory gene expression in primary adipocytes from HFD WT or HFD H2AKO mice. n=6 per group. All data represent mean+/-SEM. See also Figure S5.

