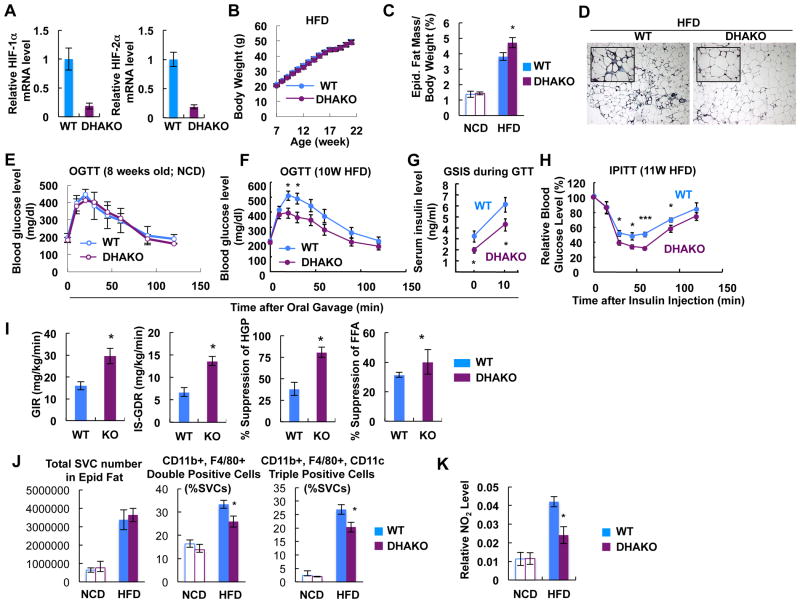
Figure 7.
DHAKO mice exhibit similar metabolic changes to HAKO mice. (A) mRNA levels of HIF-1α and HIF-2α in adipose tissue of HFD WT or DHAKO mice. (B) B.W. of WT and DHAKO mice on HFD. n=18 or 20 per group. (C) eWAT mass on NCD and HFD (15 weeks). n=7 or 10 per group. *, P<0.05. (D) Trichrome (blue) and H&E stainings of eWAT from mice fed a HFD for 15 weeks. (E-F) GTT in mice fed a NCD (E) or HFD for 10 weeks (F). *, P<0.05. (G) Plasma insulin level during GTT in panel F. (H) ITT in mice fed a HFD for 11 weeks. *, P<0.05; ***, P<0.001. (I) Hyperinsulinemic euglycemic clamp with mice fed a HFD for 15 weeks. *, P<0.05. (J) Flow cytometry analysis of eWAT SVCs. n=7 or 10 per group. *, P<0.05. (K) Nitrite level in eWAT of WT and DHAKO mice on chow or HFD. n=4 or 5 per group. *, P<0.05. All data represent mean+/-SEM.

