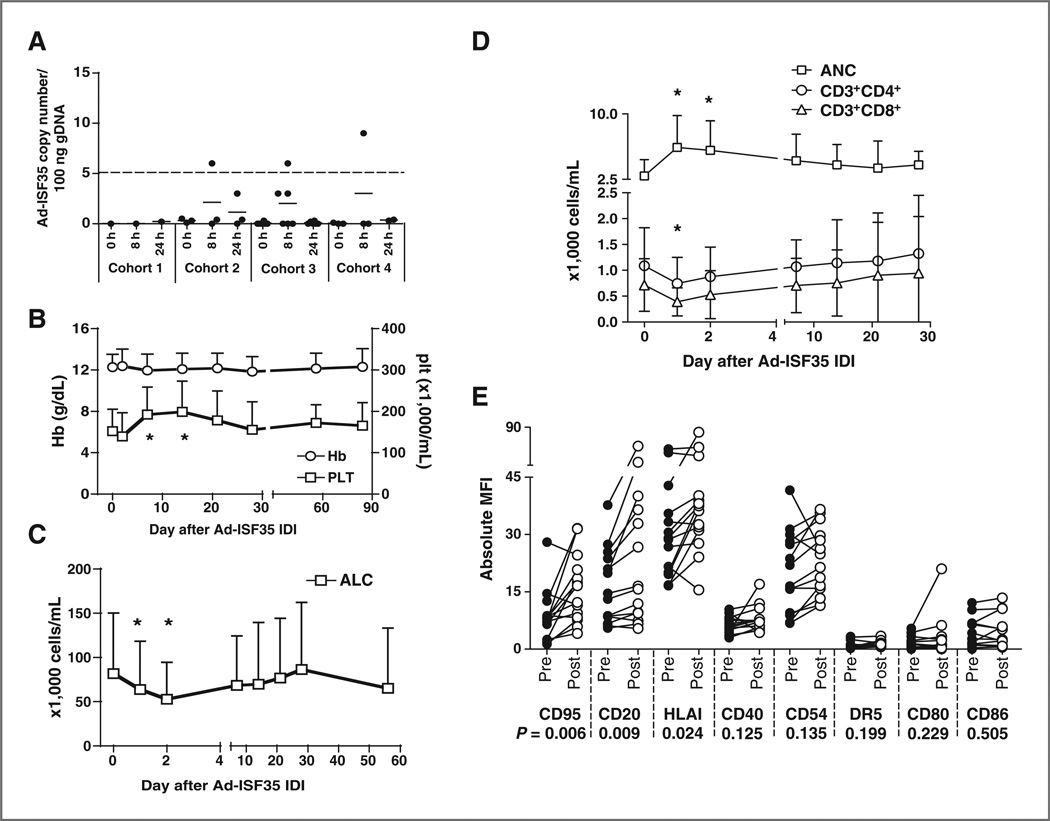
Figure 1.
Laboratory parameters in patients who received Ad-ISF35 IDI. A, DNA isolated from blood leukocytes of patients that received Ad-ISF35 IDI was evaluated for the presence of virus DNA by qPCR. The dotted line indicates the limit of detection of this assay (5 copies of Ad-ISF35 in 100 ng of genomic DNA). B, hemoglobin (Hb) levels and platelet counts (plt). C, absolute lymphocyte counts (ALC). D, T-cell counts (CD3+CD4+ and CD3+CD8+ subsets) and ANC of all patients over time following IDI of Ad-ISF35 are represented in the graphs. E, expression of cell surface markers in CLL cells obtained pre- and post- (1–2 days) Ad-ISF35 IDI. Error bars represent the SD. *, statistical significant difference by t test when compared with baseline level. MFI, mean fluorescence intensity.

