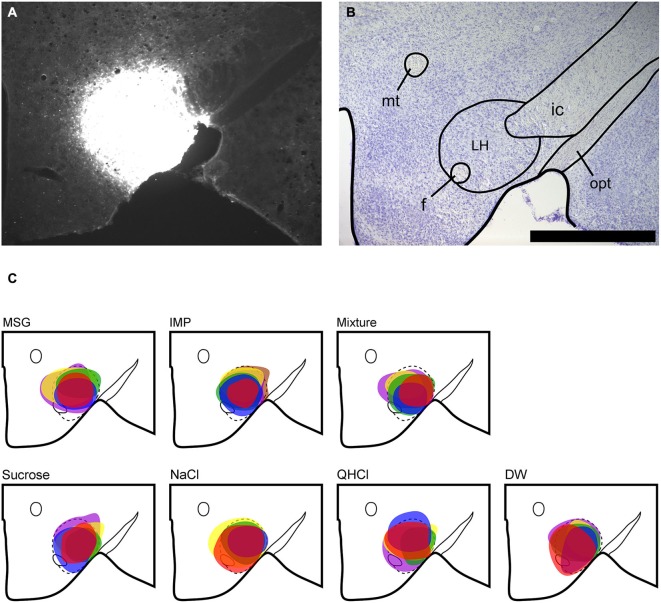
Figure 1.
LH injection sites. (A) Representative fluorescent image of FG injection site in the LH. (B) Nissl-stained section showing level of LH injection. (C) Plots of injection site and size (maximal extent) for each animal according to stimulus group; note that colors only identify separate animals within each stimulus subgroup, and do not convey any meaning across groups. Scale bar = 500 μm. mt, mammillothalamic tract; f, fornix; ic, internal capsule; opt, optic tract.

