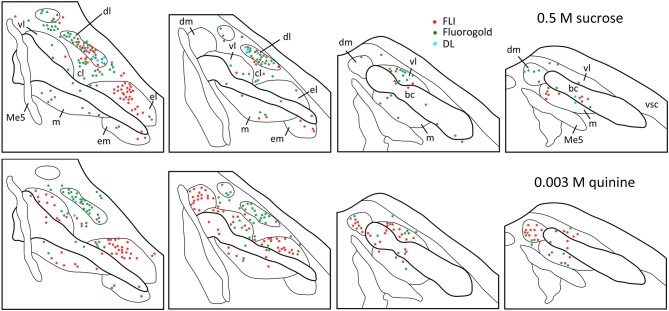
Figure 4.
Representative plots showing distributions of FG (green circles), FLI (red circles) and double-labeled (blue circles) neurons in the PbN in response to intraoral sucrose (top) and QHCl (bottom). Sections are organized from rostral (left) to caudal (right), and spaced approximately 80 μm apart. Each set of plots was constructed from a single mouse. Me5, mesencephalic trigeminal nucleus; vsc, ventral spinocerebellar tract.

