
Figure 6.
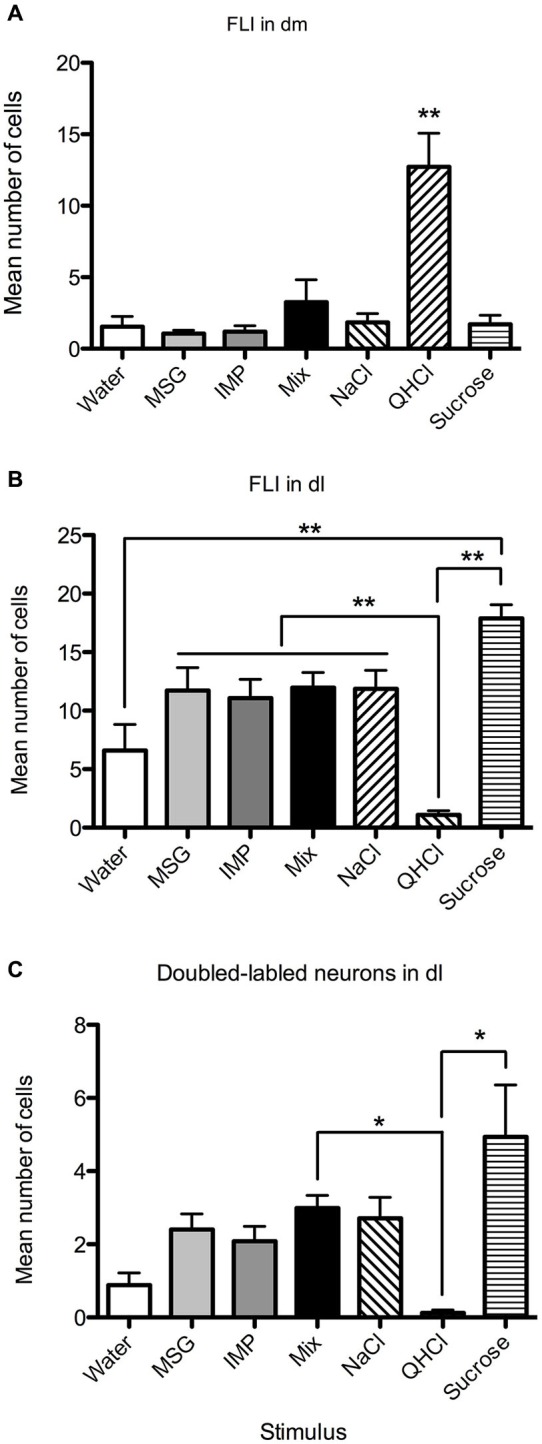
Quantification of labeled neurons in particular PbN subnuclei. These plots highlight group differences shown in Figure 5 (same data). (A) QHCl evoked significantly more FLI in cells in the dm than did other stimuli. (B) Sucrose evoked significantly more FLI in cells in the dl than QHCl or water; all groups significantly differed from quinine. (C) QHCl stimulation resulted in significantly fewer double-labeled cells than were found with sucrose or the mixture. Significance was established with post-hoc testing (A–B, Bonferroni; C, Dunn’s test); * p < 0.05; ** p < 0.01.