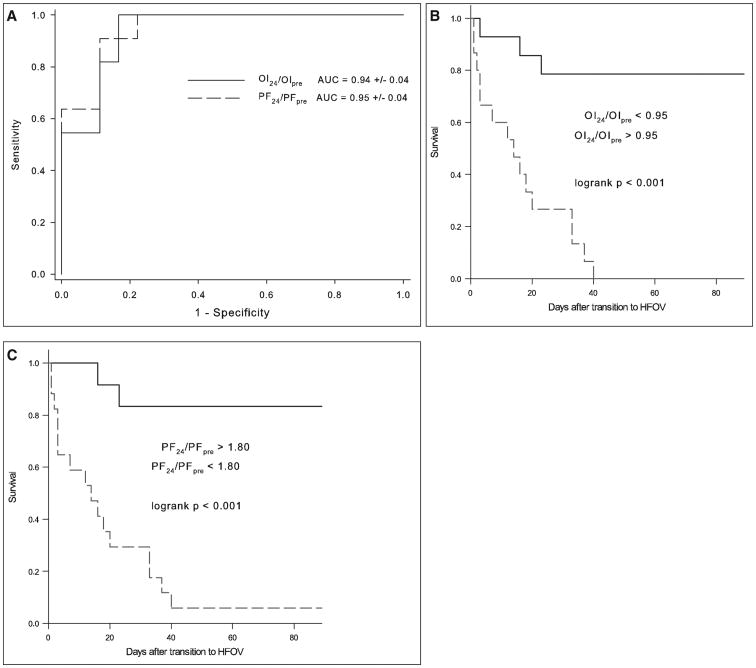
Figure 3.
A, Receiver operating characteristic (ROC) curves and associated calculated areas under the curve (AUC) for oxygenation index (OI) and Pao2/Fio2 (PF) 24 hr after transition to high-frequency oscillatory ventilation (HFOV) as a fraction of pretransition values (OI24/OIpre and PF24/PFpre). AUCs are expressed as fractions (± sem). Kaplan-Meier survival curves for OI24/OIpre (b) and PF24/PFpre (C) after determination of optimal cutoffs from sensitivity-specificity analysis.

