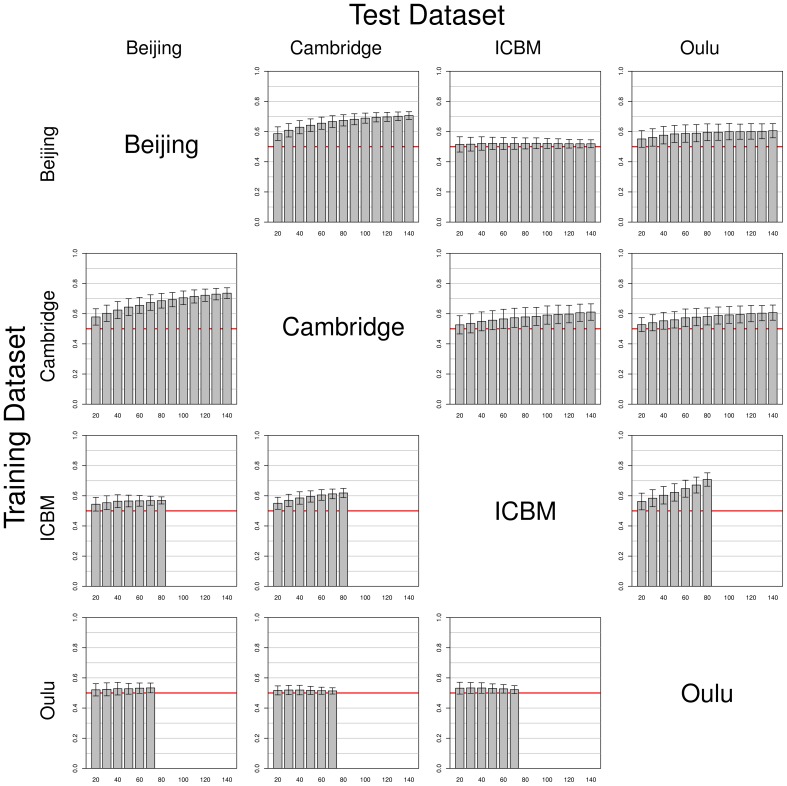
Figure 4.
Simulations using test and training datasets from two different studies among the four largest FCon datasets, with each row having the same study as a source for training datasets (varying training dataset size) and each column having the same study as a source for the test datasets (fixed test sample size, see section 2). Bars and whiskers represent means and standard deviations of test accuracies. Note the asymmetric behaviors of some pairings (e.g., Beijing/ICBM vs. ICBM/Beijing, and how the Oulu dataset yielded higher accuracies when used as a test dataset as opposed to being used as a training dataset).

