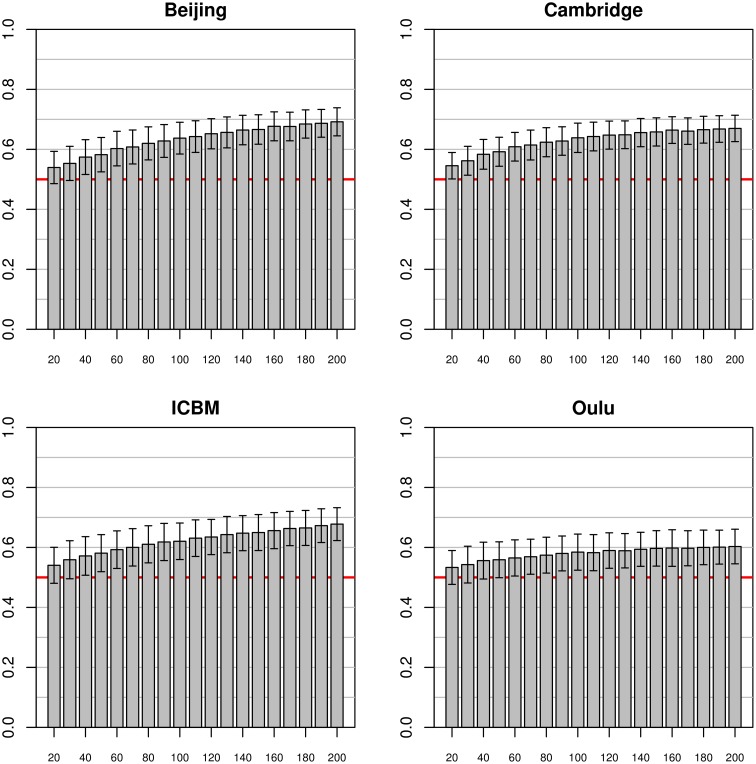
Figure 5.
Simulations using training datasets from the pooled sample and using subjects from a single study as test dataset. Bars and whiskers represent means and standard deviations of the test accuracies. Mean test accuracies for the Beijing, Cambridge and ICBM datasets appeared to asymptotically approach about 0.68, while accuracies using the Oulu dataset seemed to level out at a lower levels of about 0.6.

