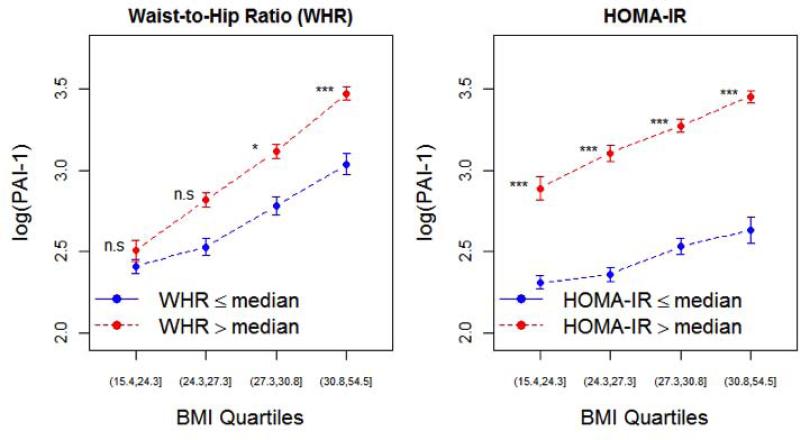
Figure 3. PAI-1 as a function of cardiometabolic risk and obesity.
PAI-1 levels (log-transformed) across quartiles of BMI, stratified by median WHR or HOMA-IR. Error bars represent 95% confidence intervals of the mean. Comparisons across HOMA-IR and WHR groups made by Student's t-tests (with Bonferroni adjustment for multiple hypothesis testing). * P < 0.05; ** P < 0.01; *** P < 0.001, ns = not significant.

