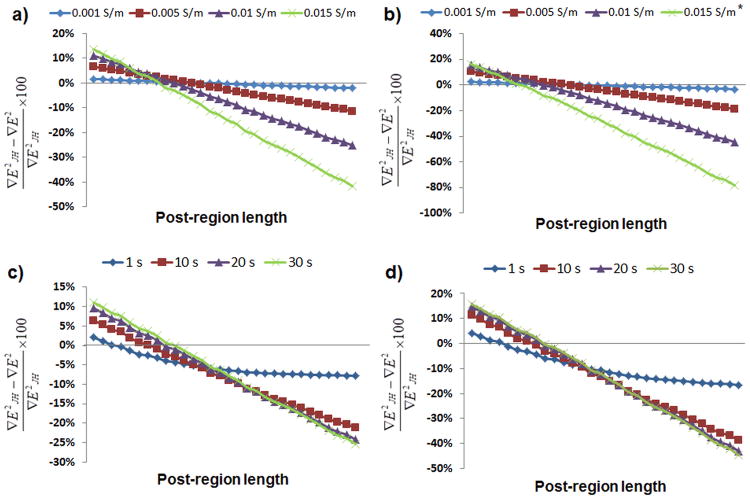
Figure 4.
Difference between the values for the gradient of the electric field squared (∇E2) when Joule heating is considered and when it is not. By applying a) 1,000 V and b) 1,500 V for 30 s to buffers with four different initial conductivities; by applying c) 1,000 V and d) 1,500 V to a buffer with σ0= 0.01 S/m and graphing the difference at 1, 10, 20, and 30 s. * The simulation with σ0= 0.015 S/m at an applied potential of 1,500 V was terminated at 17 s since the system reached 100 °C after this time.

