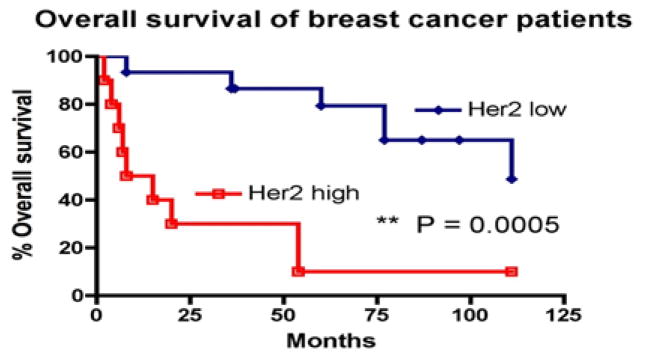
Figure 2.

Serum HER2 ECD levels and overall survival in breast cancer. Kaplan–Meier survival curve of patients with high and low serum HER2 ECD levels. Months indicate the time after serum sample collections. Patients were under standard care and might have been exposed to clinical treatments at the time of serum collections.
