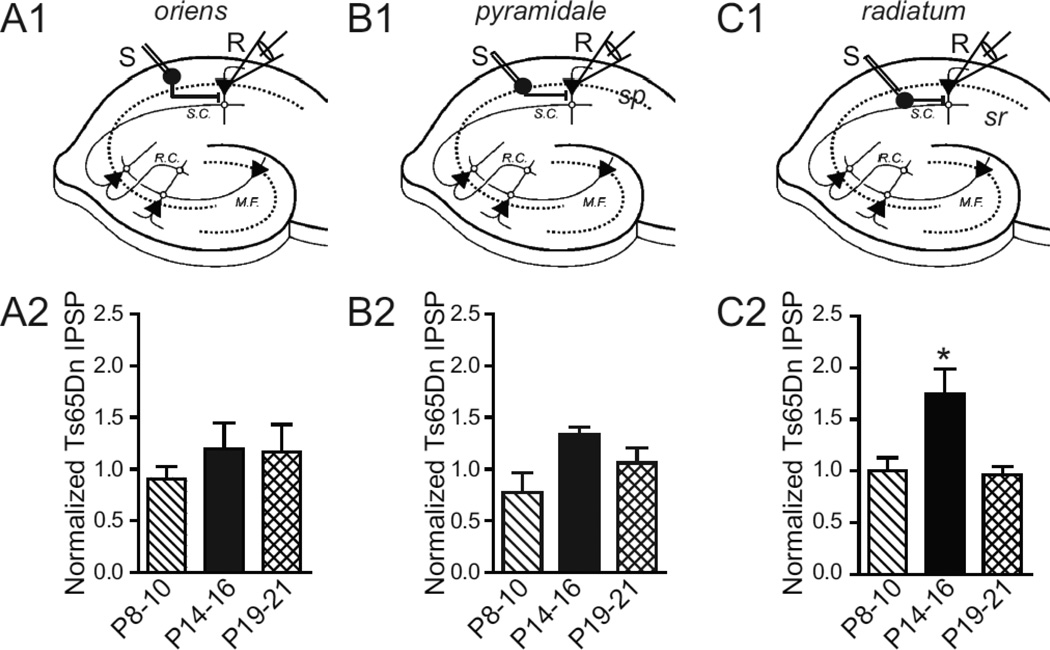
Figure 2. Developmental Time course of Synaptic Inhibition.
(A1–C1) Schematic diagrams depicting the placement of stimulating and recording electrode in the CA1 region. Inhibitory interneurons in s. oriens (so, A1), s. pyramidale (sp, B1), and s. radiatum (sr, C1), respectively, are stimulated by an extracellular stimulating electrode (S) while the inhibitory response is measured from a CA1 pyramidal neuron by the recording electrode (R). (A2–C2) The mean IPSP amplitude in response to 300 µA Stimulation Intensity in Ts65Dn animals normalized to the age-matched mean IPSP in 2N littermates, shown at different developmental times: P8–10, P14–16, and P19–21 for s. oriens (A2), s. pyramidale (B2), and s. radiatum (C2), respectively. The mean inhibitory synaptic strength of Ts65Dn animals normalized to 2N littermates is significantly greater at ages P14–16 and is observed only when stimulating inhibitory interneurons and/or their axons located in the s. radiatum (P < 0.05, t - test). P8–10; n=6, 2N; n=5, Ts65Dn; P14–16; n=8, 2N; n=7, Ts65Dn; P19-P21; n=7, 2N; n=7, Ts65Dn, where ‘n’ refers to the total number of animals in each age group.

