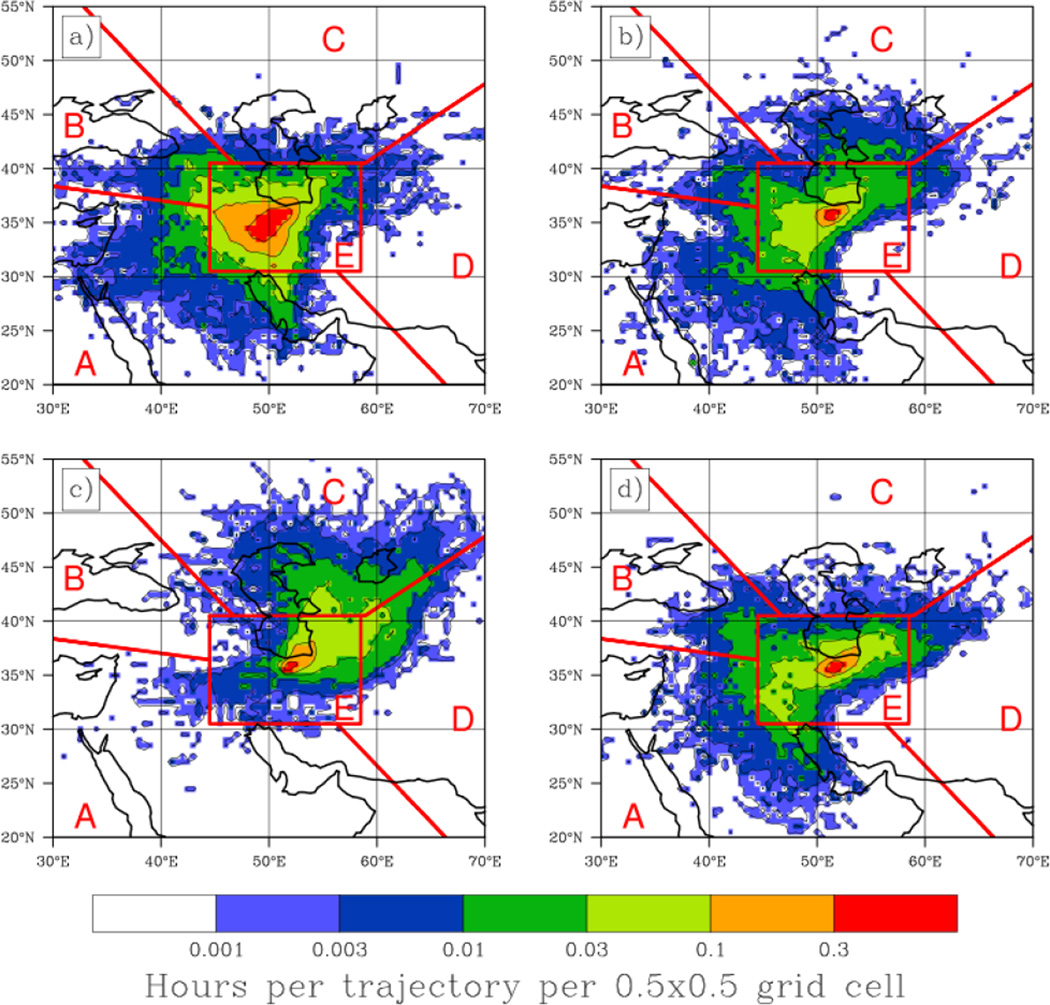
Figure 4.
Decadal (2000–2009) summary of seasonal HYSPLIT five-day back-trajectory frequencies, ending at 500m above Tehran (35.70°N, 51.42°E) for (a) winter (DJF), (b) spring (MAM), (c) summer (JJA), and (d) fall (SON). Frequency is defined as the number of trajectory-hours spent in each 0.5° × 0.5° grid box divided by the total number of trajectories analyzed. Source regions, as illustrated in Figure 3, are overlaid.

