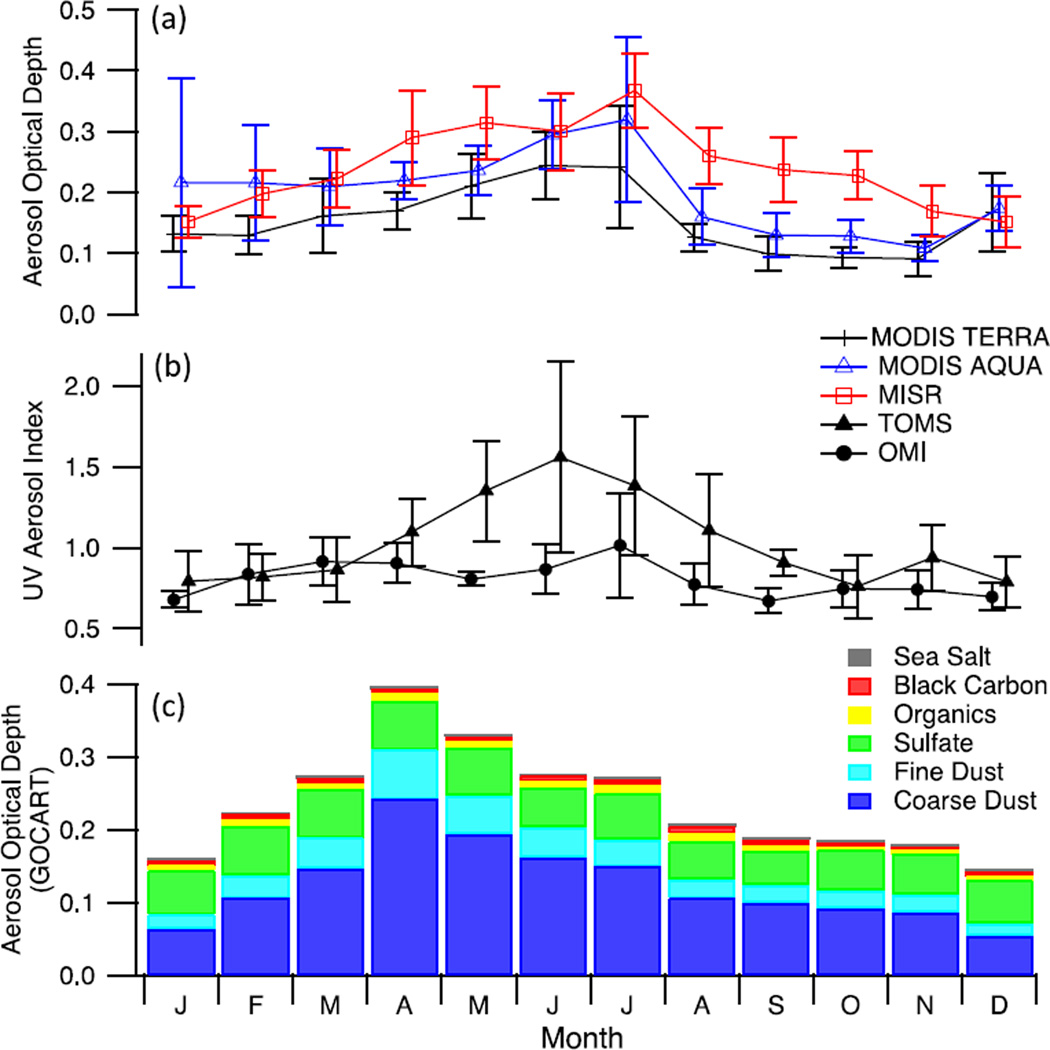
Figure 6.
Monthly summary of remotely-sensed and model data for the greater Tehran area (see Table 1) for different satellite products (a and b): (a) aerosol optical depth (AOD) from MODIS Deep Blue (Terra and Aqua) and Multi-angle Imaging Spectroradiometer (MISR); (b) Total Ozone Mapping Spectrometer (TOMS) and Ozone Monitoring Instrument (OMI) ultraviolet aerosol index; (c) monthly summary of fractional AOD from Goddard Ozone Chemistry Aerosol Radiation and Transport (GOCART).

