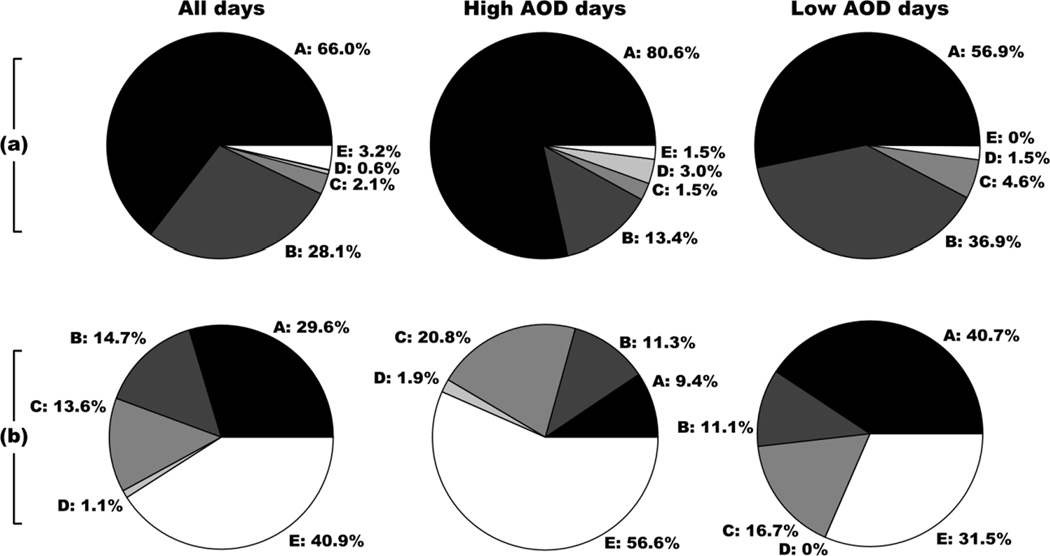
Figure 8.
Air mass source origin for all days, high AOD days (>90th percentile) and low AOD days (<10th percentile) for (a) spring upper air trajectories (ending altitude of 3000 m AGL) and (b) winter low level (500 m AGL) trajectories. High and low AOD days were identified using the consolidated MODIS Deep Blue (Terra and Aqua) and MISR AOD data.

