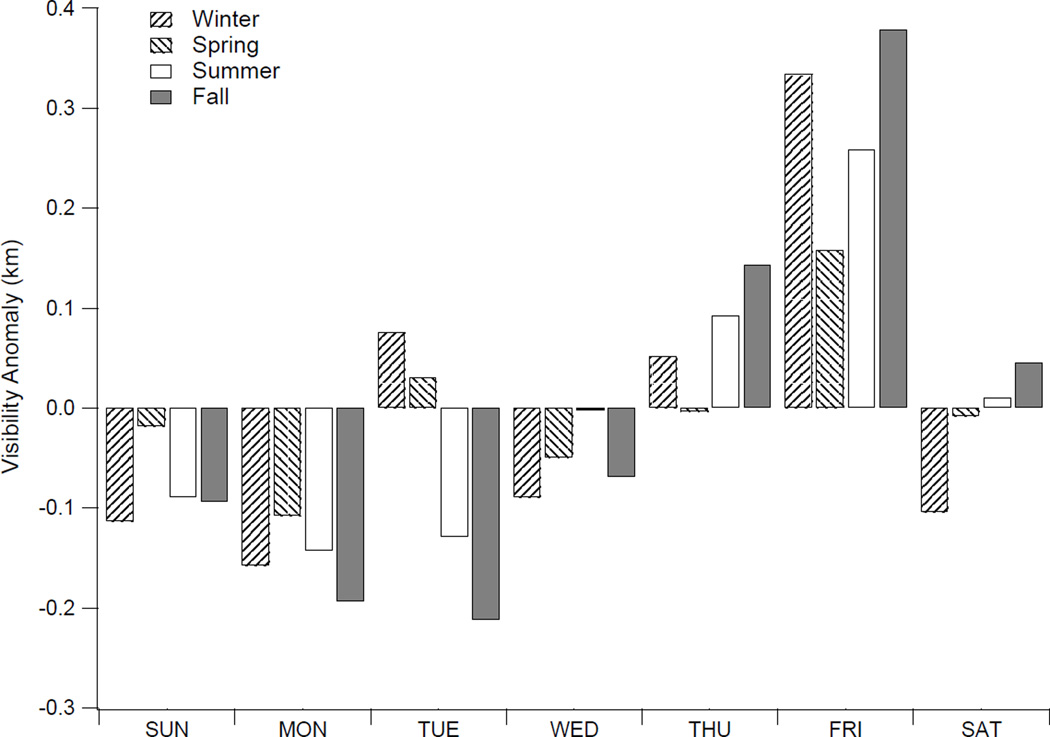
Figure 9.
Average visibility anomaly in Tehran (Mehrabad) filtered by day-of-week for each season of the year. The visibility anomaly is calculated as the average deviation for each day-of-week from the climatological mean for each season. Note that the weekend in the study region is Friday, although some industries also observe Thursday as a reduced working day.

